
The Visual
Scan:
Reading Space
Before Drawing
Start a Conversation
TL;DR
Three things this page establishes
A structured walkthrough of your building — what we call the Visual Scan — turns observable patron behavior into defensible space and service recommendations before any architect is retained or any capital budget is committed. Done correctly, it costs a fraction of a programming study and prevents the most expensive planning mistakes. The Visual Scan is not an inspection; it is an interpretive act, drawing on fifty years of behavioral evidence gathered across academic, municipal, government, and specialized library installations. Everything you need to understand what it is, how it works, and when to request one is on this page.
The Director Who Knew Something Was Wrong
A scenario that repeats itself across institutions
A director at a mid-sized academic library had watched circulation drop for three consecutive years despite adding databases, extending hours, and hiring a new outreach librarian. The collection was sound. The staff was competent. The building was fifteen years old and had been renovated once. Something was wrong, but no one could name it precisely enough to act on it. When we arrived for a Visual Scan, we did not open a spreadsheet. We walked. We stood at the main entrance for twenty minutes at three different times of day and watched where people went — and, more instructively, where they did not go. Within four hours of observation, the adjacency problem was clear: the most heavily requested materials were shelved in a wing that required passing the reference desk, which students were actively avoiding. The service point that was meant to assist was functioning as a barrier. No survey would have caught it. No space utilization report would have named it. But it was visible to anyone trained to read a building.
That story is not unusual. It is representative. The Visual Scan is the fastest, most cost-effective diagnostic tool a library can commission before spending money on anything else.
Why Observation Is the Foundation of Library Performance Assessment
What the Visual Scan Reveals That Surveys Cannot
Patron surveys measure stated preferences. Circulation statistics measure what people borrowed. Gate counts measure how many people entered. None of these instruments tells you what happened between the door and the destination — and that interval is where nearly every spatial dysfunction originates. The Visual Scan is a structured observation protocol that reads the building as a behavioral system. It documents where people pause, where they accelerate, where they cluster, and where they give up. It identifies the zones that are physically present but functionally invisible, the service points that generate approach anxiety, and the adjacencies that make a collection appear smaller than it is. These findings are not impressionistic. They are grounded in a methodology developed across hundreds of installations and refined continuously against outcomes data from completed projects.
The observations are cross-referenced against the institution's own utilization data, staffing patterns, collection footprint, and stated service priorities. The result is not a list of complaints. It is a ranked sequence of spatial interventions, each one tied to an observable patron behavior and a projected service outcome. That sequence becomes the foundation for any subsequent master planning engagement, capital campaign, or service point redesign.
Tracing actual movement paths from entry to destination, identifying friction points, bypass behaviors, and zones of underutilization that never appear in circulation reports.
Evaluating the spatial relationships between service points, collections, and seating to determine whether the building's layout reinforces or contradicts its stated service model.
Assessing whether staff positions, signage systems, and desk configurations communicate their purpose immediately to a first-time visitor, or create ambiguity that reduces approach rates.
Identifying the relationship between lighting quality, acoustic separation, furniture configuration, and the duration of patron stays — the factors that determine whether a library functions as a destination or a pass-through.
What the Visual Scan Reveals: Reading the Spatial Narrative
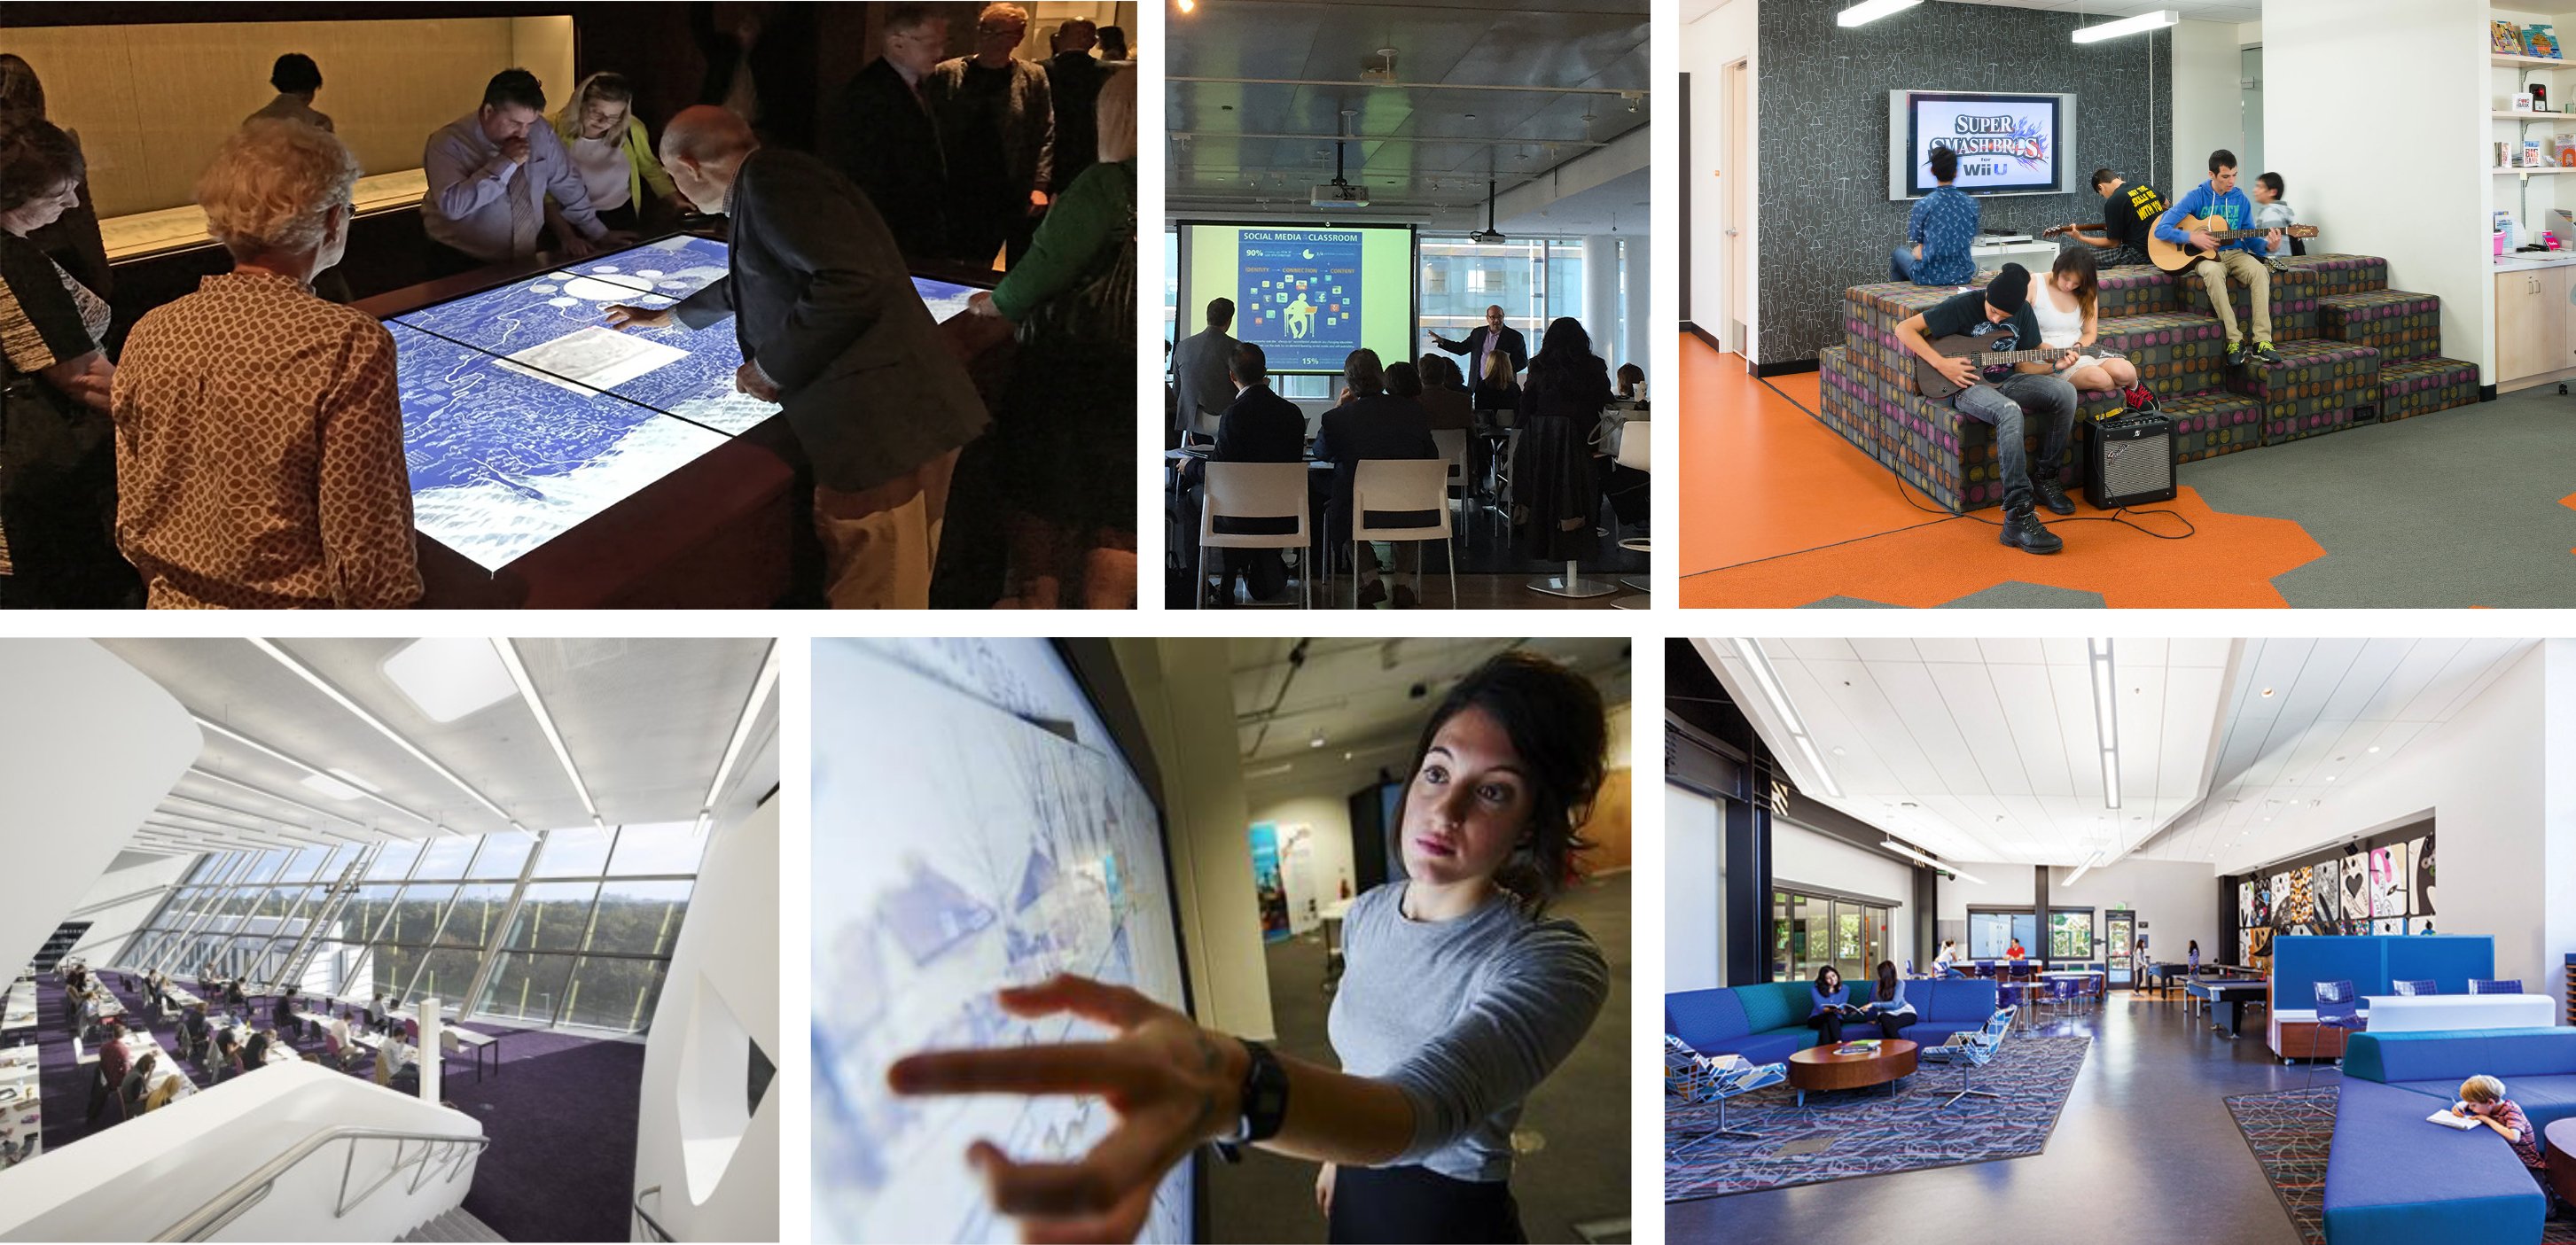
Every building tells a story. Most institutions are not reading it.
A library building is not a neutral container. Its proportions, its sight lines, its threshold conditions, and its circulation paths all communicate priorities — intentionally or not. When those communications contradict the institution's service model, utilization suffers and no amount of programming, outreach, or marketing will correct it. The Visual Scan reads the building's spatial narrative and identifies where the story the building tells diverges from the story the institution wants to tell.
The entrance sequence is typically the most revealing. What does a patron see within the first three seconds of entry? If the answer is a security gate, a circulation desk positioned as a barrier, and a wall of signage, the building has communicated restriction before it has communicated welcome. That first impression shapes every subsequent decision the patron makes about where to go, how long to stay, and whether to return. These are not abstract design preferences. They are behavioral outcomes with measurable consequences for door counts, session lengths, and collection use rates.
The Visual Scan also examines the building's secondary zones — the areas that sit beyond the first fifty feet of entry — where the most significant underutilization typically occurs. Reference stacks, periodical collections, group study rooms, and specialized service points are frequently located in positions that patron movement patterns never organically reach. Relocating a single service point, repositioning a signage system, or reconfiguring a threshold can redirect flow toward those zones without any capital expenditure. That is the class of intervention the Visual Scan is designed to find. For institutions approaching a larger capital commitment, see our work on building the evidence base for a bond campaign.
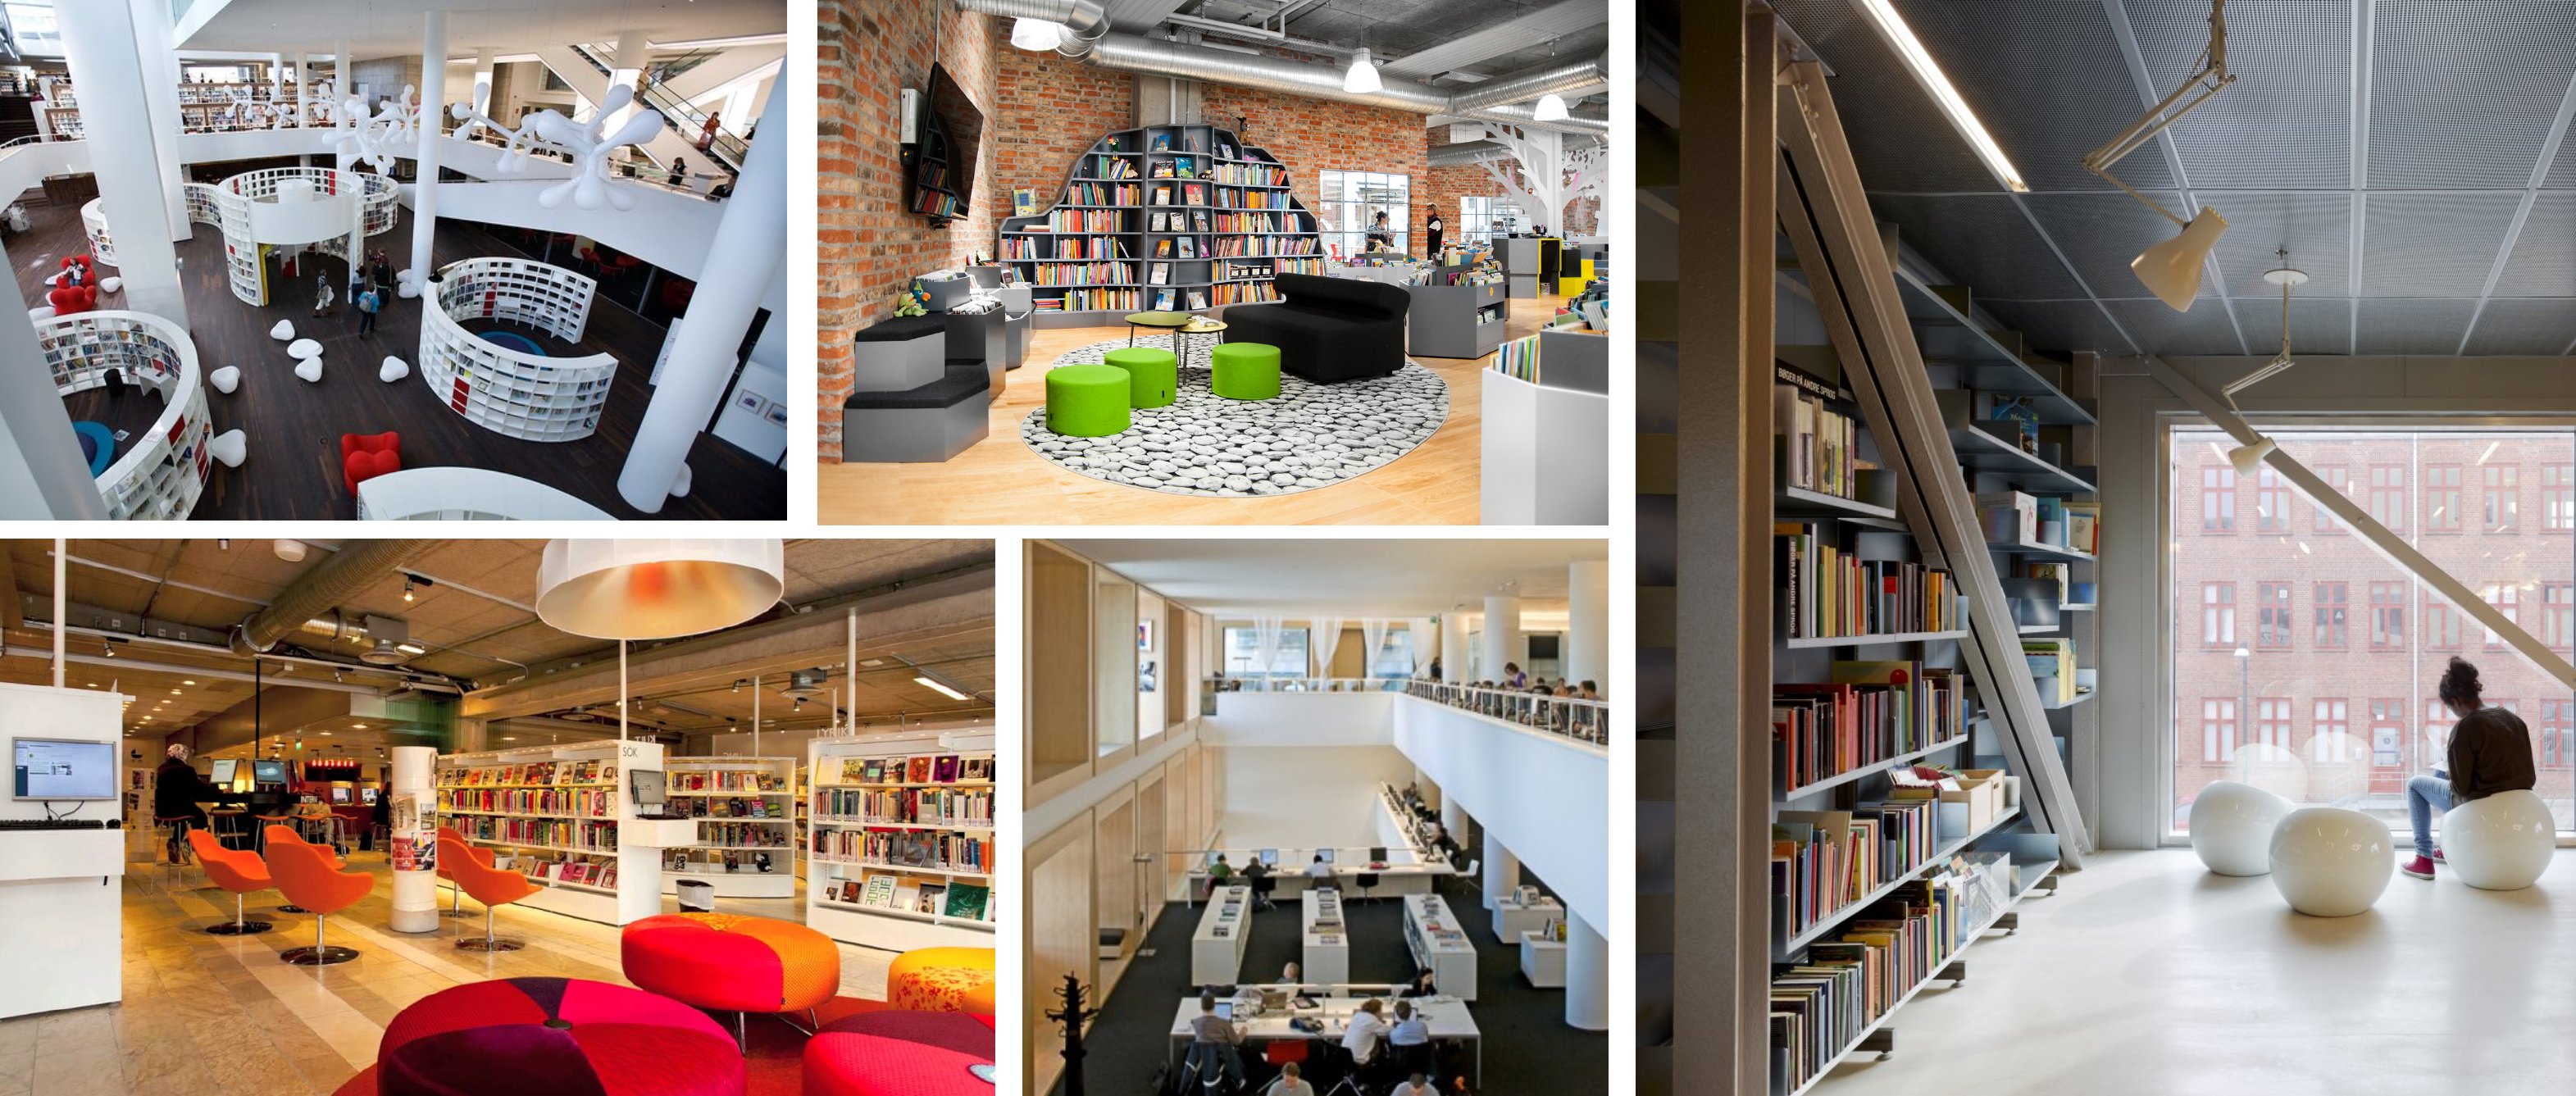
Spaces That Have Been Read and Transformed
How a Visual Scan Engagement Works
From First Contact to Actionable Findings
The Visual Scan is a structured engagement with a defined scope and a deliverable that can be acted upon independently or folded into a larger planning process. It begins before we set foot in the building. We review whatever utilization data the institution can provide — gate counts, circulation statistics, room booking records, floor plan drawings — not to draw conclusions from them, but to formulate the right observational questions before the walkthrough begins. Data tells us where to look. The walkthrough tells us what to see.
The on-site observation phase typically spans one to two days, conducted at different times of day and across different patron populations. We observe entrances, exits, service desks, collection areas, seating configurations, wayfinding systems, and technology access points. We document what we see in writing and in annotated floor plans. We also conduct brief, unstructured conversations with patrons and staff — not interviews, but exchanges that surface the institutional knowledge that never makes it into any formal report.
Analyzing existing utilization records, floor plans, and service documentation to identify the highest-value observational targets before the walkthrough begins.
Conducting structured walkthroughs at morning, midday, and afternoon sessions to capture the full range of patron behaviors across different use contexts and population segments.
Delivering a written report with annotated floor plan overlays that document observed behaviors, identify dysfunction sources, and sequence recommended interventions by cost and impact.
Connecting Visual Scan findings directly to subsequent programming, master planning, or capital campaign work so that observational evidence anchors every downstream decision.

When to Commission a Visual Scan
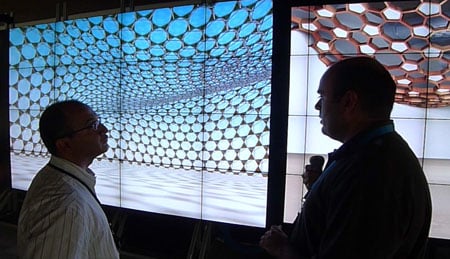
The right diagnostic at the right moment in a planning cycle
The Visual Scan is most valuable at four specific points in an institution's planning lifecycle. The first is before any capital commitment is made. If a director or board is considering renovation, expansion, or new construction, the Visual Scan establishes a behavioral baseline that the eventual building program must address. Without it, the program rests on assumptions about how patrons use space that may be entirely wrong — and those assumptions, once embedded in construction documents, cost a great deal to correct. See our framework for grounding library capital decisions in defensible evidence.
The second application is after a completed renovation or new construction, when utilization has not met projections. This is more common than institutions like to admit. A new building can fail behaviorally even when it succeeds architecturally. The Visual Scan identifies the gap between the design intent and the patron experience, and proposes low-cost interventions that can recover the utilization the institution expected.
The third application is in advance of a strategic planning cycle. Many institutions begin strategic planning with a service analysis and an environmental scan. The Visual Scan grounds both of those instruments in observed reality, ensuring that the strategies developed in the planning process will actually work in the physical environment where they must be executed.
The fourth application is as a standalone diagnostic for institutions that do not have an immediate capital project in view but sense that something in the building is limiting performance. The Visual Scan answers that question specifically and affordably, without committing the institution to a larger engagement. For institutions already engaged in a broader consulting relationship, the Visual Scan findings are routinely folded into the work described on our library performance assessment page.
The Visual Scan Across Library Sectors
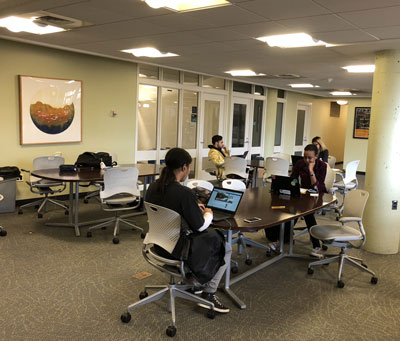
Different institutions, same observational discipline
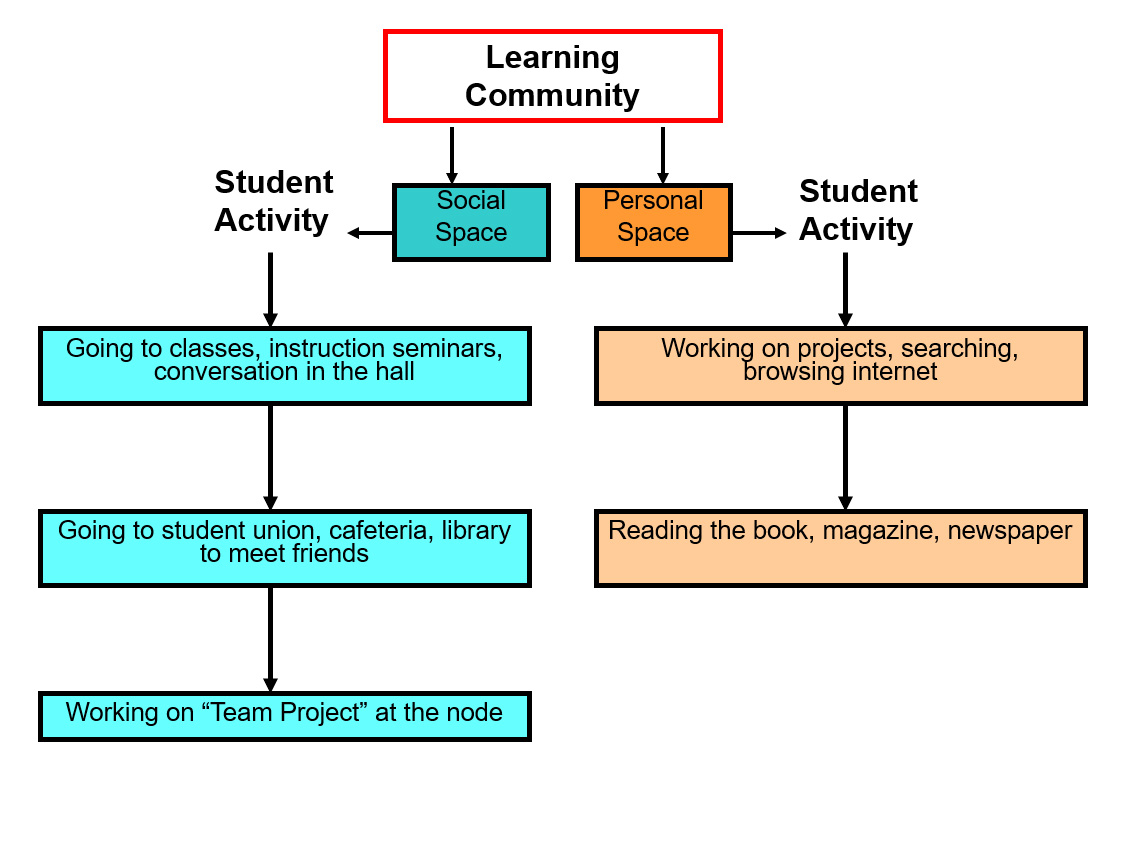
The Visual Scan protocol applies across every library type we serve, but its findings differ significantly by sector because the patron populations, service models, and collection configurations are fundamentally different. In an academic library, the dominant behavioral question is how students move between independent study, collaborative work, and digital access — and whether the building's zone structure supports that sequence or forces patrons to choose. The adjacency between group study rooms, library instruction spaces, and collection areas is typically the highest-leverage design variable. For a deeper treatment of academic library spatial strategy, see our work on translating enrollment data into defensible space programs.
In a public library, the Visual Scan focuses on the building's ability to serve simultaneous, often incompatible patron populations — children and older adults, job seekers and recreational readers, program participants and quiet-study users. The spatial narrative in a public library must accommodate all of these without privilege or conflict. Acoustic separation, sight lines from staff positions, and the placement of community program spaces relative to the main collection are the variables that most frequently require intervention. Our public library design consulting framework extends these findings into full community-centered planning.
In a law, medical, or specialized research library, the Visual Scan addresses the intersection of access control, collection density, and researcher workflow. These environments have security requirements and adjacency protocols that do not exist in general libraries, and the behavioral consequences of misaligned spatial design are more immediately felt — in researcher time lost, in collection access delayed, and in staff workflows that cannot be executed efficiently. Our sector-specific frameworks for law library consulting and medical library facility planning build directly on Visual Scan findings.
Building the Evidence Base: From Observation to Action
What comes after the Visual Scan
A Visual Scan does not end at observation. Its value is fully realized only when the findings are connected to an actionable sequence of interventions. That sequence has three tiers. The first tier is zero-cost: furniture repositioning, signage changes, and service point adjustments that can be implemented immediately with existing resources. These changes typically produce measurable improvements in patron flow within weeks and demonstrate to institutional leadership that the building's performance problems are solvable. They also build internal confidence for the larger investments that follow.
The second tier is low-capital: interior modifications, lighting upgrades, acoustic treatments, and technology access improvements that require budget but not construction. These interventions address the environmental comfort variables that determine session length and return visit rates. The third tier is capital: structural adjacency changes, additions, or full renovations that the evidence base developed in tiers one and two makes defensible. By the time an institution reaches a capital commitment, the Visual Scan findings have already been validated by the outcomes of tier one and tier two interventions. That validation is what makes a capital case persuasive to trustees, municipal governments, and donors. For institutions preparing a formal capital case, our work on library strategic analytics and evidence-based bond campaign development extends the Visual Scan into a full institutional argument.
Identifying furniture repositioning, signage adjustments, and service point reconfigurations that produce measurable patron flow improvements without any capital expenditure.
Specifying lighting, acoustic, and technology upgrades that address environmental comfort variables and extend patron session lengths without structural construction.
Using validated tier-one and tier-two outcomes to build a defensible capital argument for structural adjacency changes, additions, or full renovations that trustees and municipal governments will fund.
Establishing the baseline metrics — gate counts, session lengths, service desk approach rates, room booking utilization — against which every intervention's impact is measured over time.
Connected Services and Related Expertise
The Visual Scan as entry point to a fuller planning engagement
The Visual Scan is designed to stand alone, but it is also the most natural entry point into a fuller planning relationship. Institutions that commission a Visual Scan and act on its zero-cost findings typically return for a master planning engagement within eighteen months, because the experience of watching the building respond to evidence-based intervention changes the institutional culture around planning. It demonstrates concretely that the building is a manageable system, not a fixed constraint.
For institutions already in a planning cycle, the Visual Scan findings integrate directly with the analytical frameworks described across our practice areas: the service point planning methodology that determines where staff, technology, and patron flow intersect most productively; the bibliometric analysis framework that connects collection configuration to researcher behavior; and the strategic planning process that aligns spatial decisions with institutional mission over a ten-year horizon.
For institutions considering a digital library development alongside a physical renovation, the Visual Scan also documents the relationship between physical access points and digital service entry points — identifying the zones where patron behavior transitions between physical and digital systems, and ensuring that the building's design supports that transition rather than interrupting it. This integration is one of the least-planned dimensions of most library renovation projects and one of the most consequential for long-term utilization.
Regardless of where your institution is in its planning cycle, the Visual Scan offers the same value: a clear-eyed account of what your building is actually doing, grounded in observed patron behavior and translated into an actionable sequence of improvements. That account is the most honest and cost-effective planning instrument available to a library director who wants to do better for the community the building is meant to serve.
To discuss commissioning a Visual Scan for your institution, contact Aaron Cohen Associates directly. We serve academic, public, government, law, medical, and specialized research libraries across the United States and internationally, and we bring to every engagement the same methodological discipline that has produced measurable improvements in library performance for more than fifty years.
Commission a Visual Scan