
Academic
Library Planner
Space Programming
Talk to a Planner
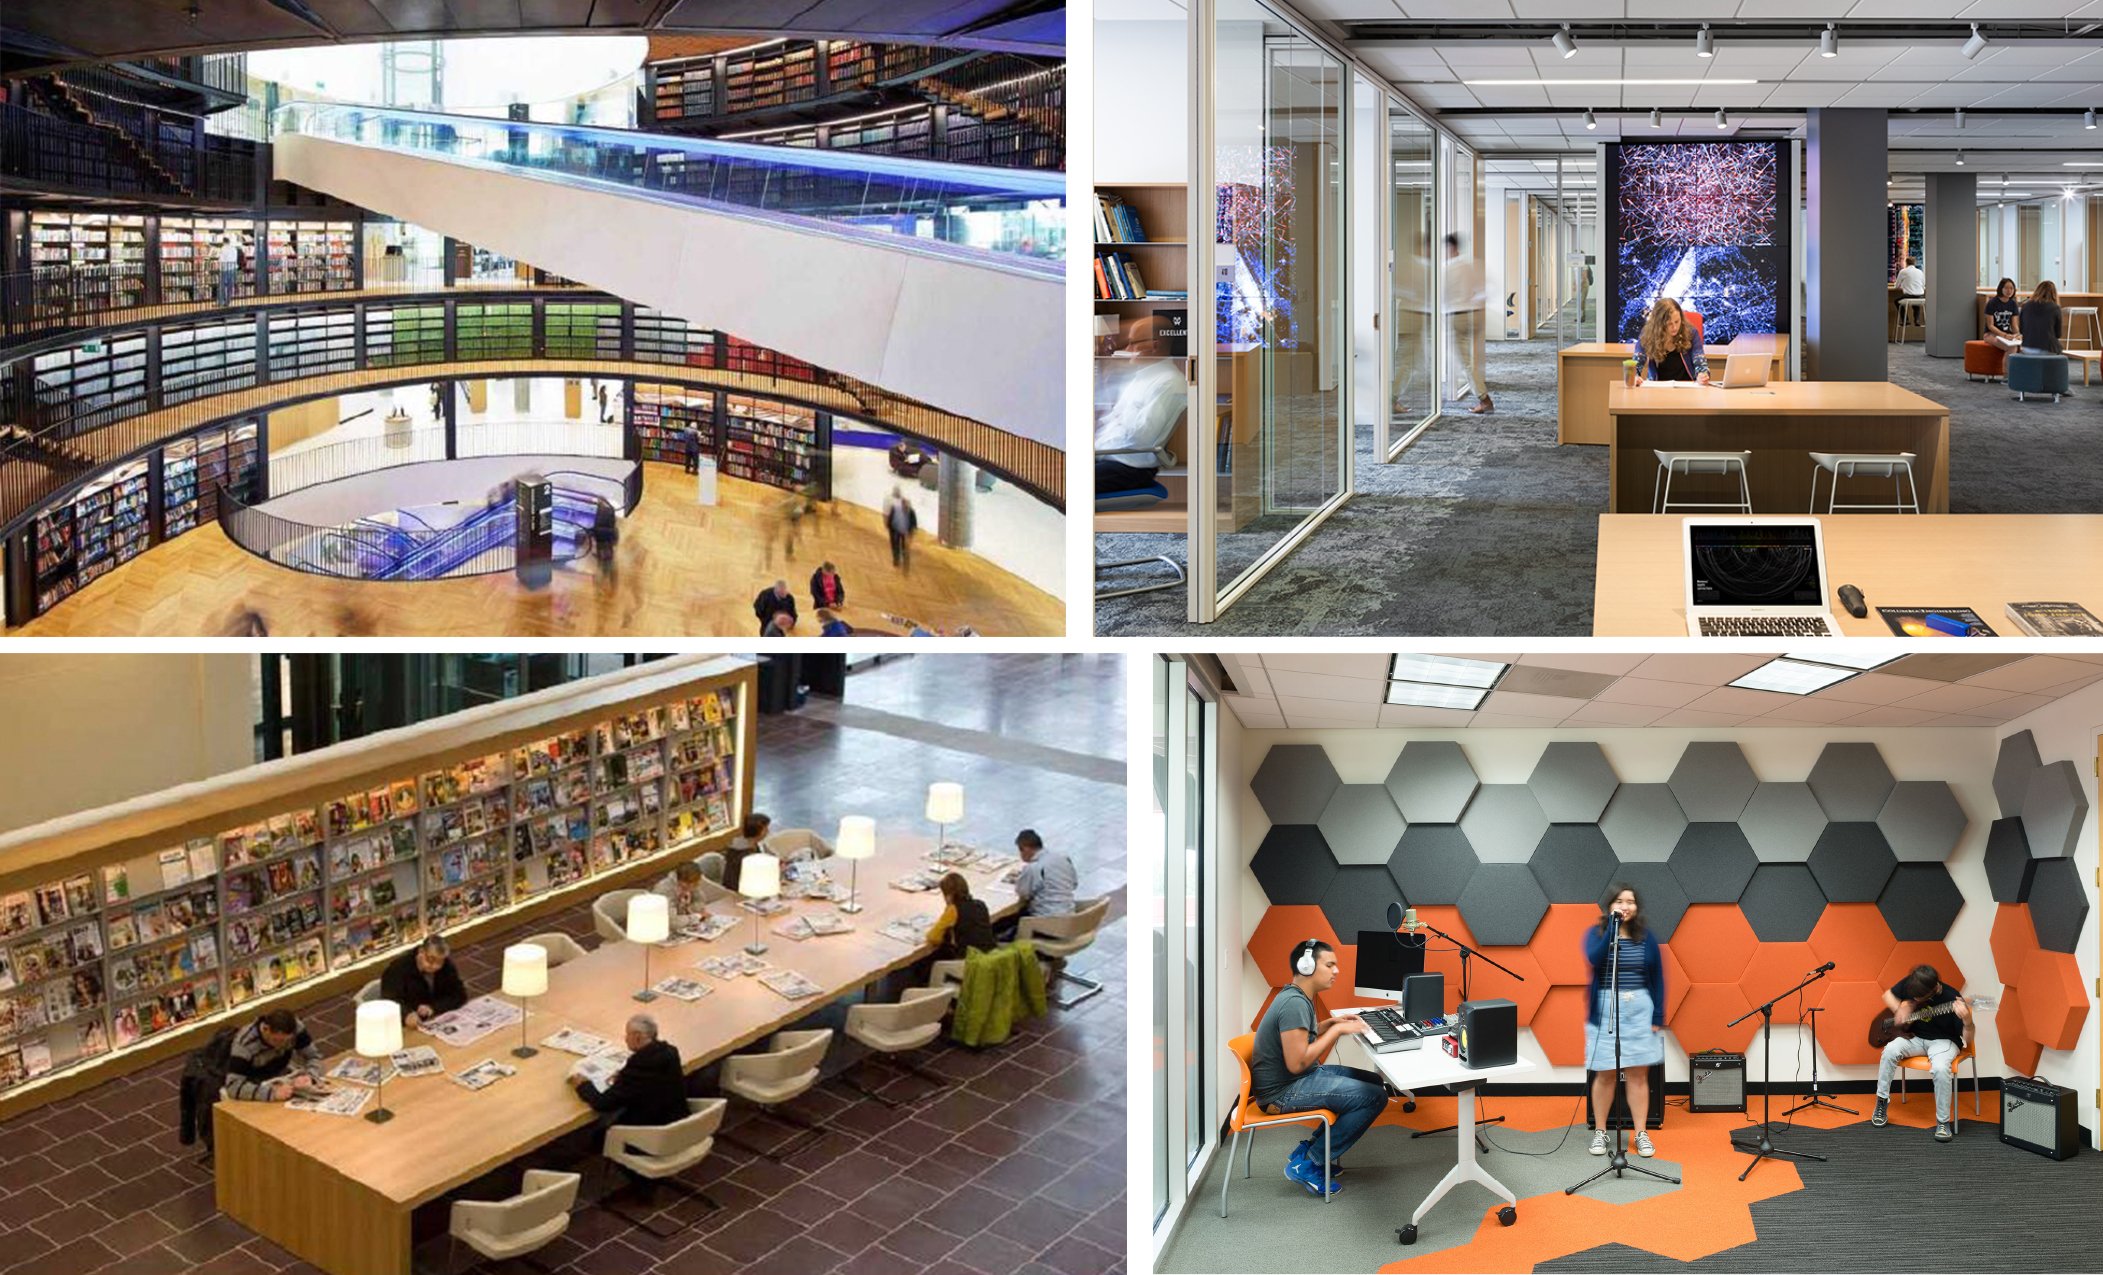
TL;DR
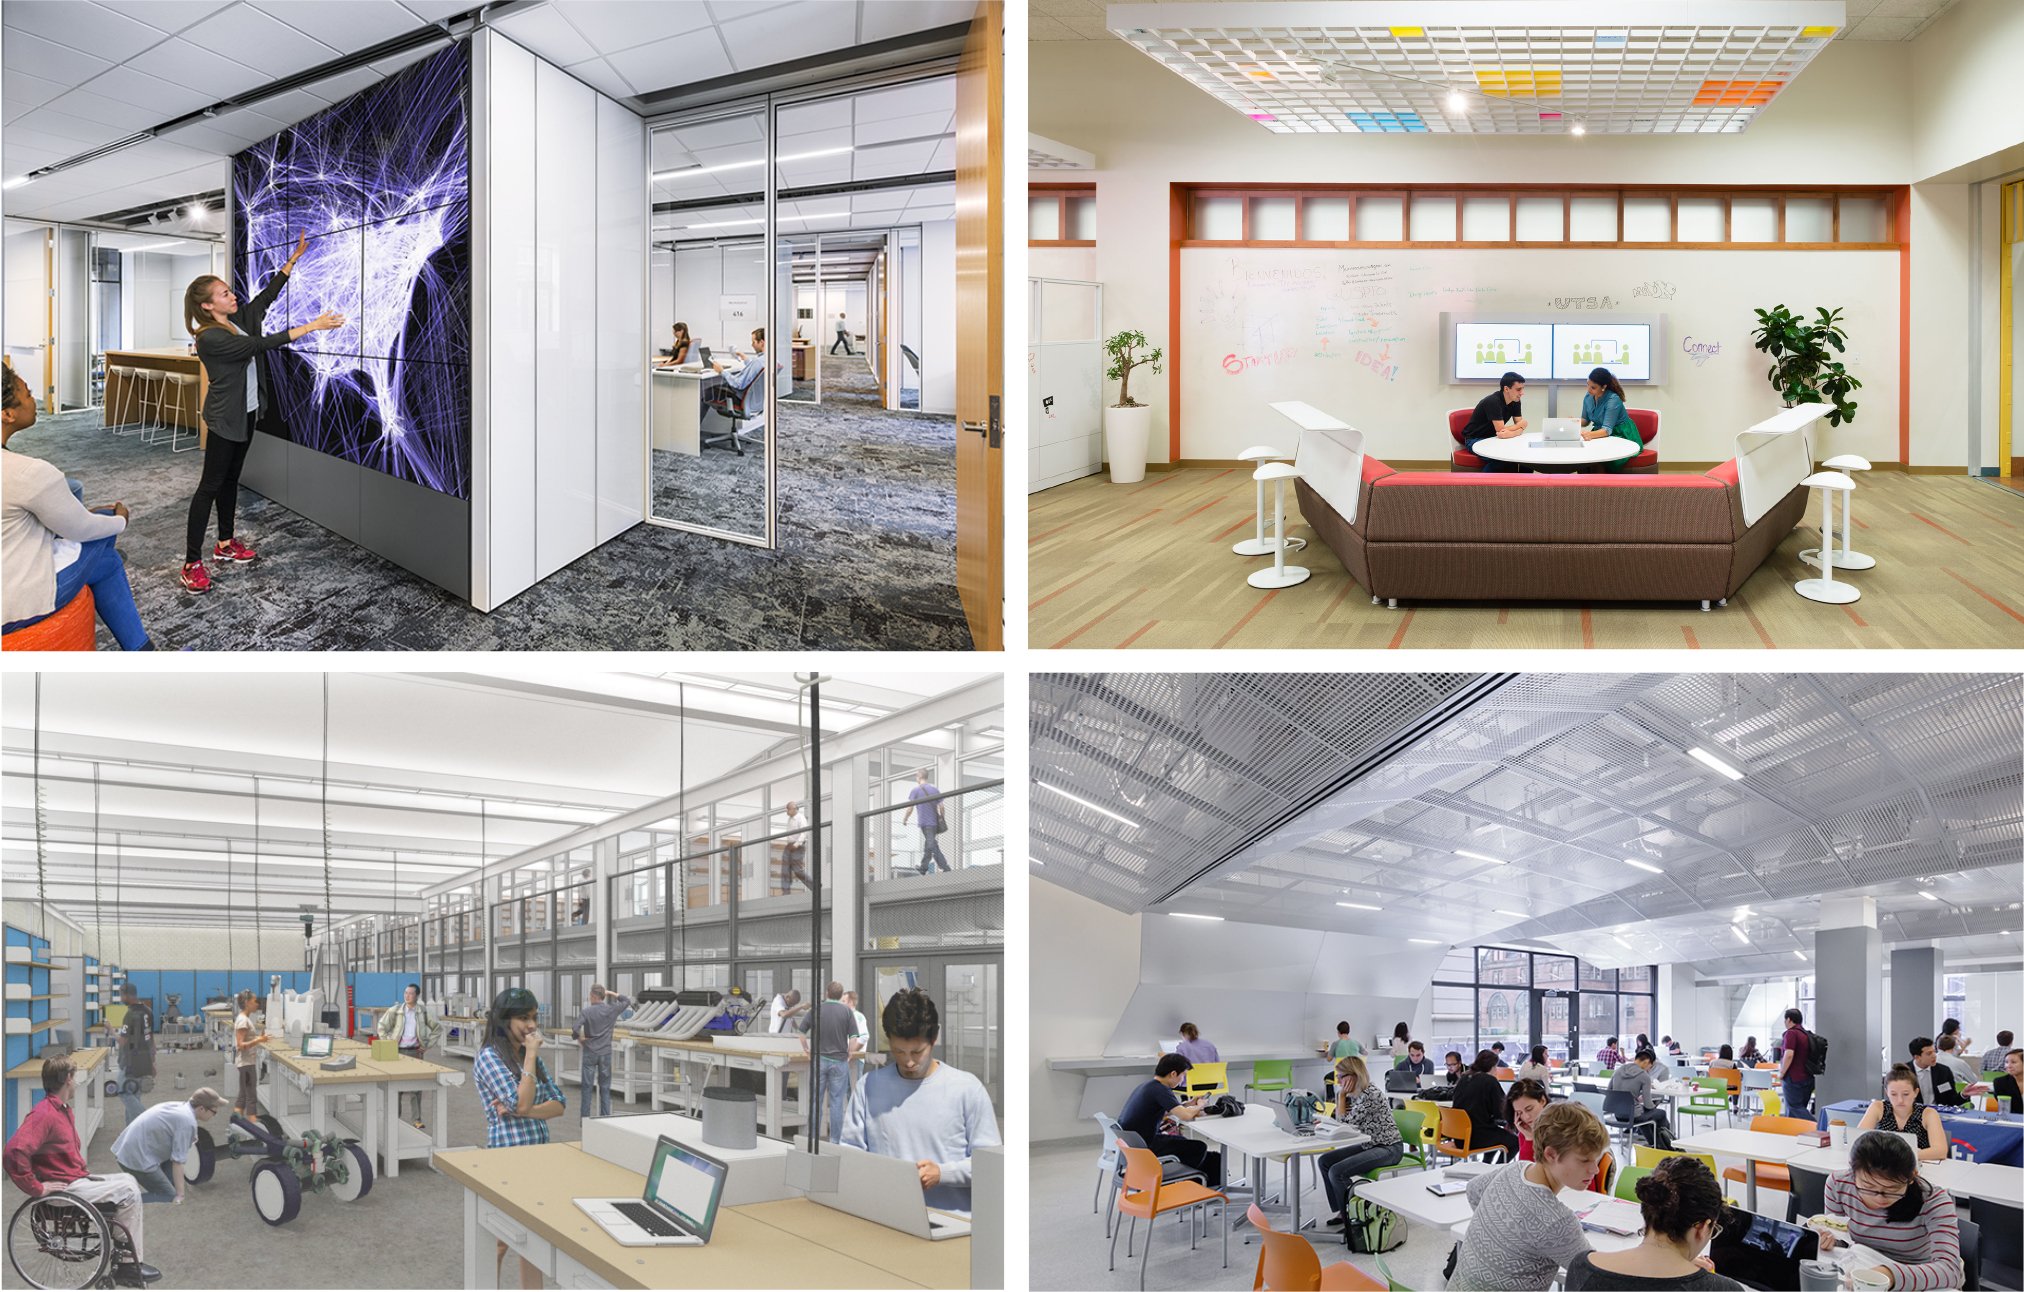
From Enrollment Data to a Defensible Space Program
An academic library planner translates enrollment projections, curriculum changes, and collection growth rates into a precise, defensible square footage program before an architect draws a single line.
Three interlocking data streams — headcount, service mix, and collection trajectory — govern the program; neglecting any one of them produces a building that fights its users within a decade.
A six-step Space Program Translation process converts raw institutional data into zone-by-zone area allocations, complete with the utilization logic a capital committee needs to approve a budget.
The Director, the Spreadsheet, and the Number the Board Wants
A Planning Problem That Cannot Be Solved With a Single Ratio
Imagine a director at a regional comprehensive university, sitting across from the vice president for finance with a planning document she has been building for six months. Enrollment is projected to climb from 12,400 to roughly 15,000 FTE over the next decade, driven largely by new health sciences and engineering programs. Her existing library, a 1979 building, runs at 83 percent of its working shelving capacity on the main stack floors. On peak days during finals, students sit on the floor in the periodicals corridor. The VP wants one number: gross square footage. The board needs it for the capital campaign feasibility study.
The director knows that if she simply extrapolates the current building at a fixed ratio per student, she will produce a figure that the building committee will accept and that an architect will immediately populate with corridors and mechanical rooms, leaving future librarians with a structure that solves yesterday's problems. She has watched that happen at a peer institution forty miles away: a building opened just eleven years ago that is already functionally obsolete because nobody modeled the shift to group-based digital learning before ground was broken.
What she actually needs is not a number. She needs a space program — a zone-by-zone argument that connects every square foot to a specific institutional purpose, a measurable service load, and a ten-year enrollment scenario. That is precisely what an academic library planner produces, and it is the only document that survives budget review intact, because every room on the list can be defended in plain language to a provost, a donor, or a bond committee. The process begins not with architecture, but with data, and it ends with a document that an architect can trust.
Separating headcount projections by cohort type — residential undergraduate, commuter, graduate, professional, and distance-local — to reveal the true spatial demand behind enrollment growth numbers.
Translating academic plan shifts — new programs, new pedagogies, new partnership spaces — into spatial typologies before a single square foot is allocated to any zone.
Auditing collections in linear feet by format, applying the 86 percent working capacity standard, and modeling digital migration offsets against faculty-validated deaccession tolerance.
Replacing retired percentage-of-population benchmarks with gate count data, peer-calibrated visits-per-seat ratios, and peak-load analysis to produce a defensible seat count and type distribution.
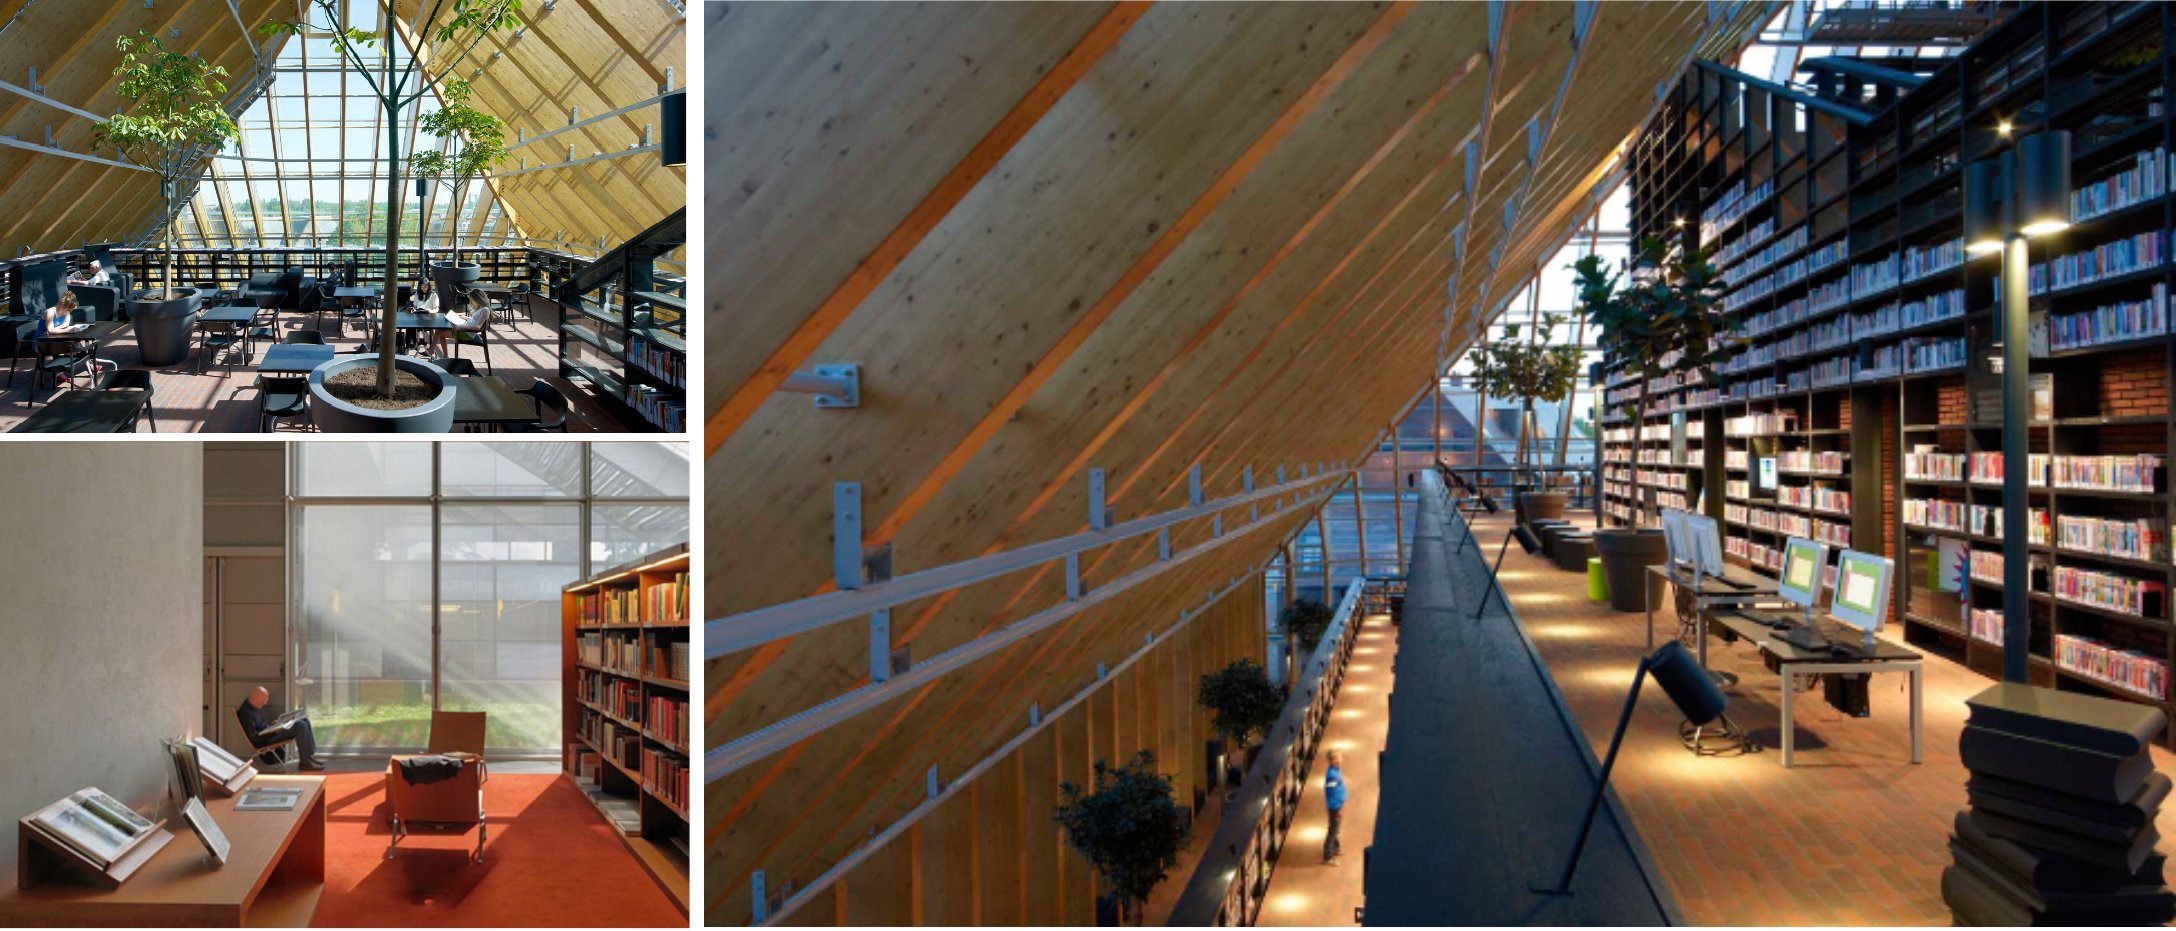
What an Academic Library Planner Actually Does With Enrollment Data
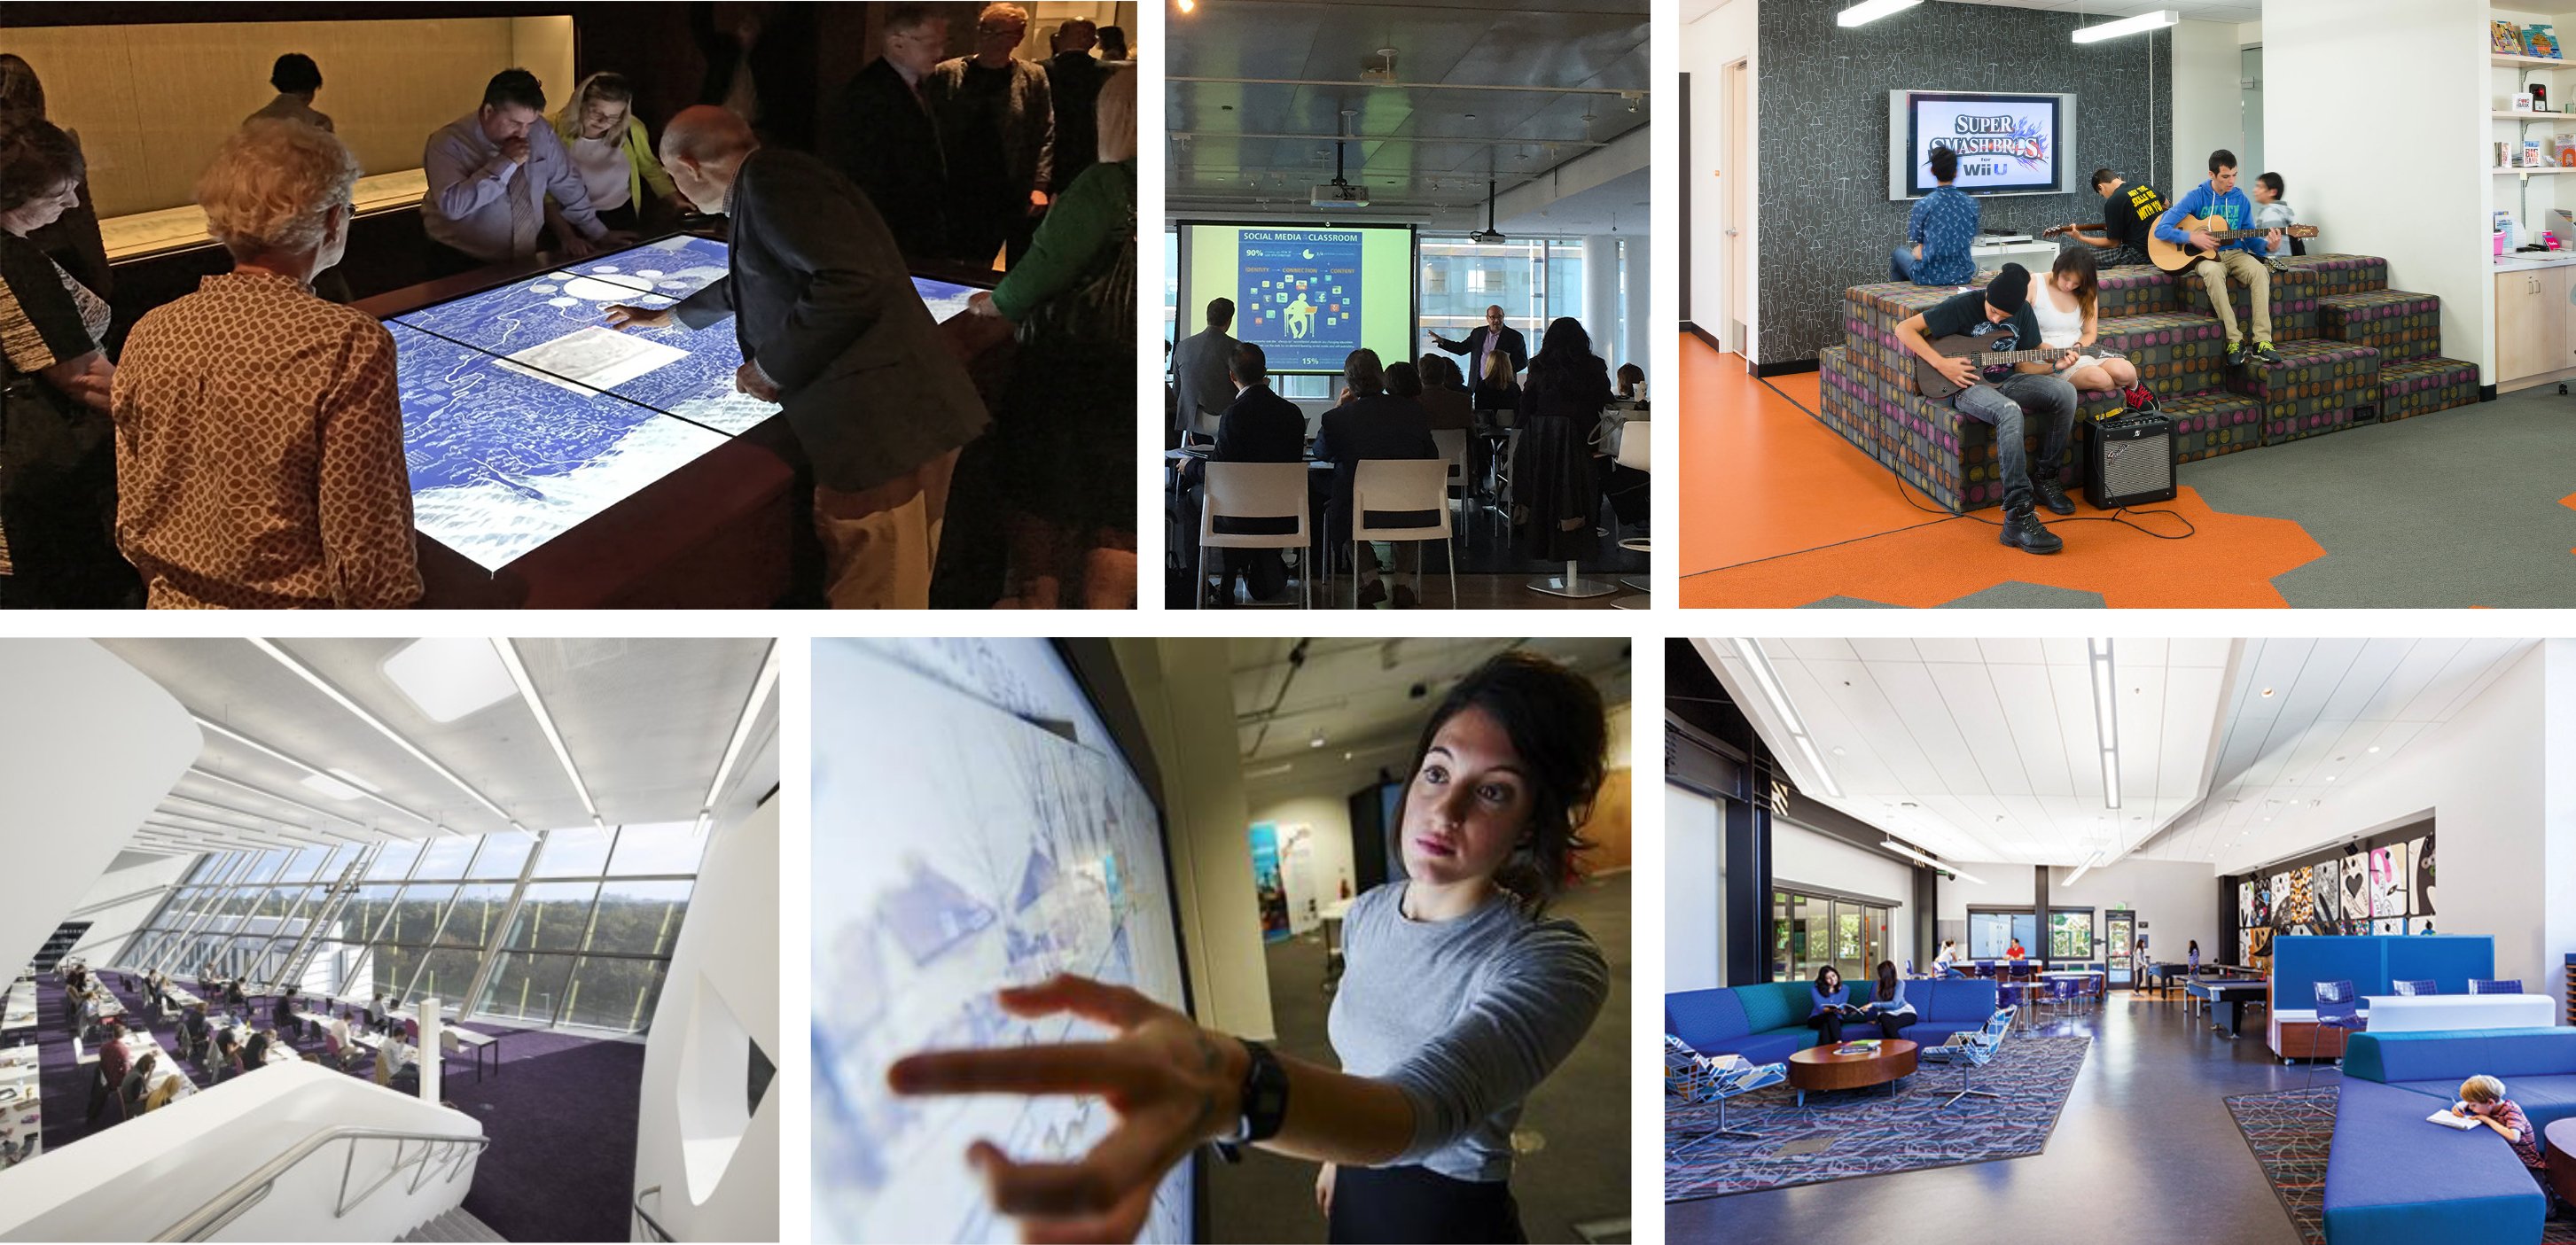
Professional Analysis Over Numeric Benchmarks
ACRL and its partner divisions have been candid for years: there are no specific national quantitative standards for academic library buildings. The organization acknowledges receiving many inquiries about numeric benchmarks and answers by offering evaluative questions rather than formulas — does the building provide well-planned, secure, and sufficient space to meet perceived needs? Are seating types varied enough to serve the full range of learning behaviors? The absence of a mandated standard is not a gap; it is a mandate for professional analysis. It places the burden of justification exactly where it belongs: on the institutional planning record.
An academic library planner begins by disaggregating enrollment projections into their constituent learning behaviors. Headcount is not homogeneous. A university adding 2,600 students over a decade through health sciences and engineering programs is not adding 2,600 identical library users. Graduate students in clinical programs have fundamentally different spatial demands than undergraduates in a large lecture-based curriculum. The planner maps each enrollment cohort — resident undergraduates, commuter undergraduates, graduate students, professional students, faculty, and distance learners with on-campus touchpoints — against research on how those cohorts actually use library space. A 2016 Project Information Literacy study of 22 library building projects found that 82 percent of projects were designed to support collaborative learning activity, 73 percent individual study, and 63 percent point-of-need services. Those percentages shift substantially depending on the academic character of the institution.
Curriculum change is the second enrollment variable that most planners underweight. A shift toward project-based pedagogy, team-taught interdisciplinary courses, or clinical simulation work does not show up in a headcount projection, but it shows up unmistakably in space demand. The same Project Information Literacy research documented that 77 percent of architects and 50 percent of librarians on recent projects placed a premium on flexible, user-reconfigurable space — not because flexibility is fashionable, but because curriculum cycles move faster than building cycles. A space program that does not map curriculum trajectory against spatial typology is guessing at a problem that can be measured.
Enrollment Data: What to Capture
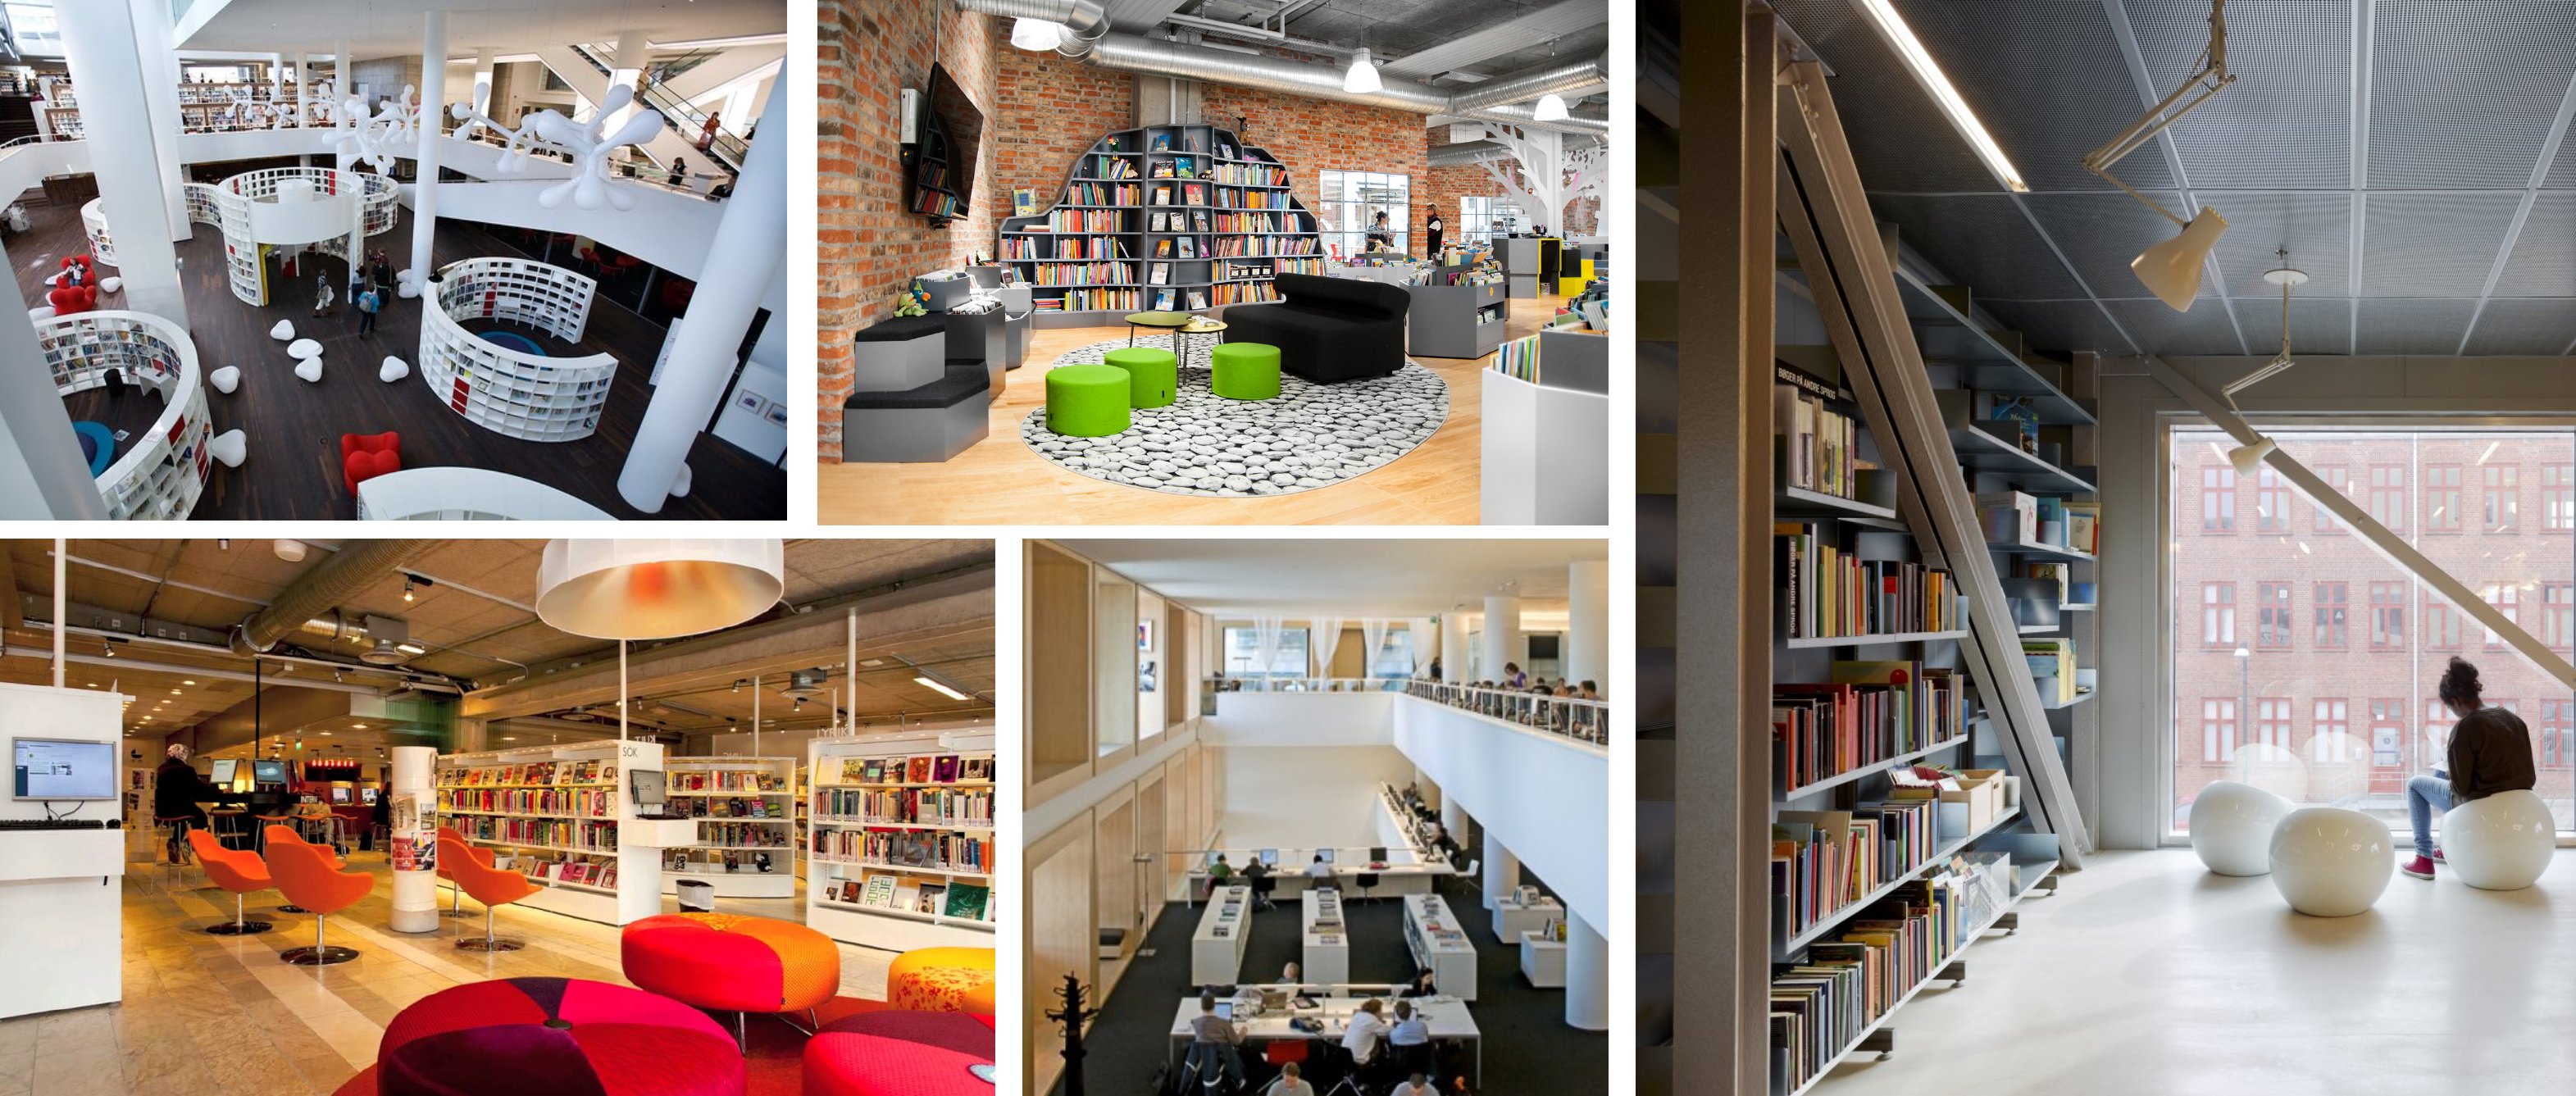
Residential undergraduate, commuter, graduate, professional, and distance-local students each generate different spatial loads. Never treat headcount as a single homogeneous figure.
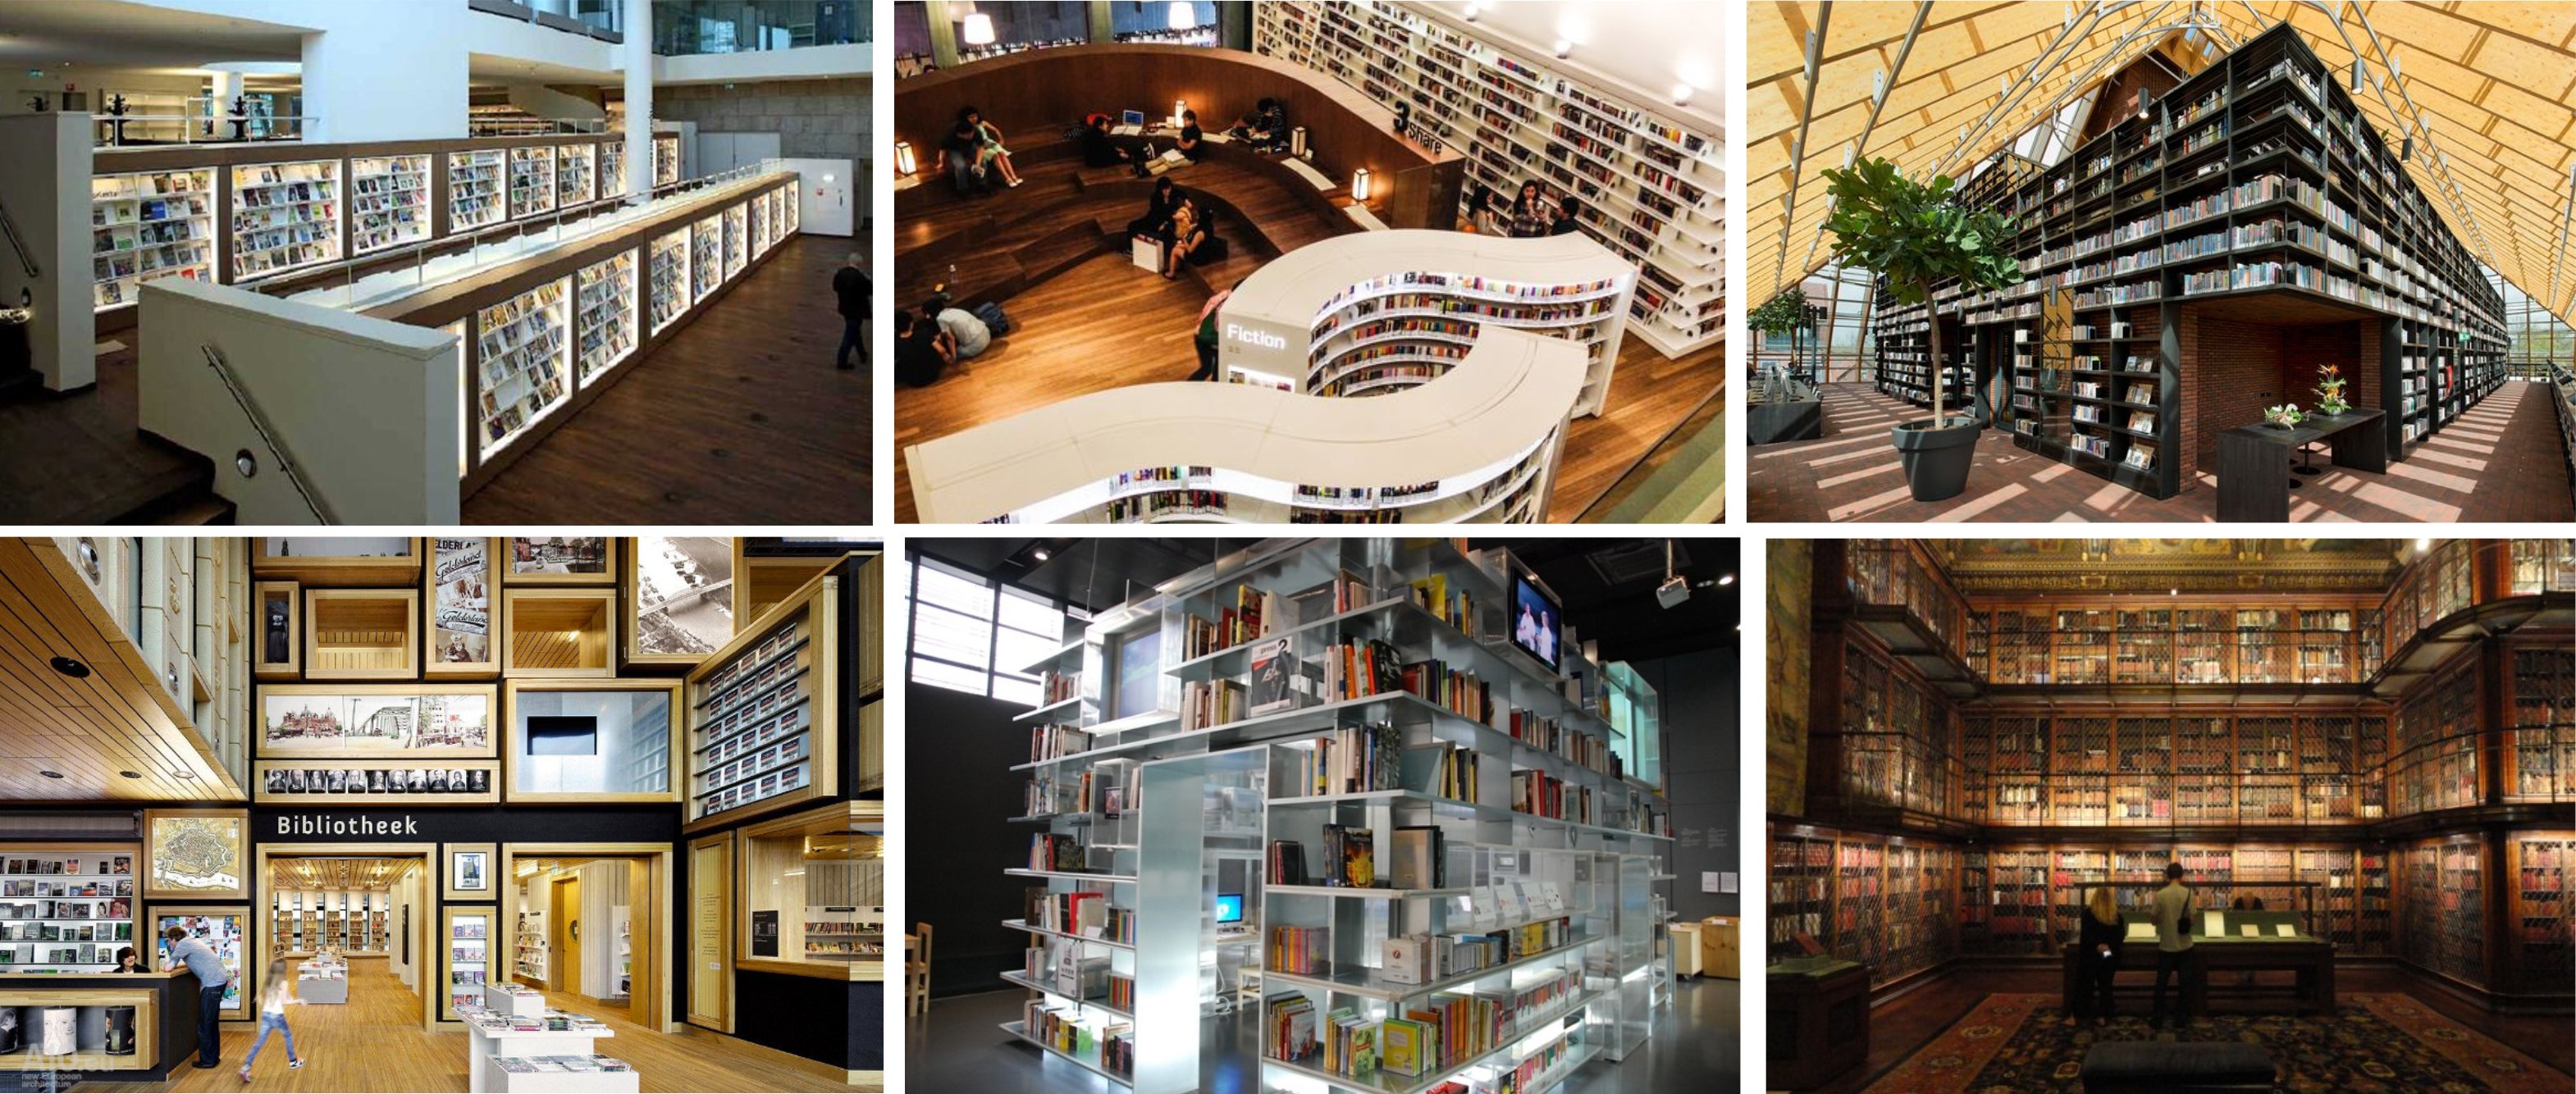
New programs, new pedagogies, and new external partnership spaces must be identified in the academic plan before enrollment numbers are translated into spatial zones.
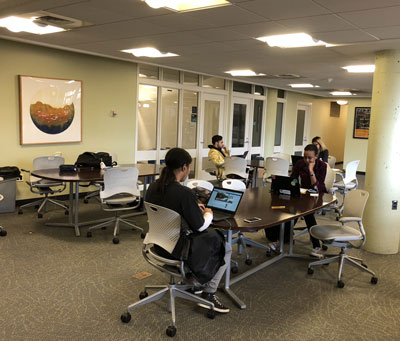
The ten-year academic plan, admissions forecast, and any strategic partnership agreements with academic health systems, law schools, or corporate partners must all inform the program.
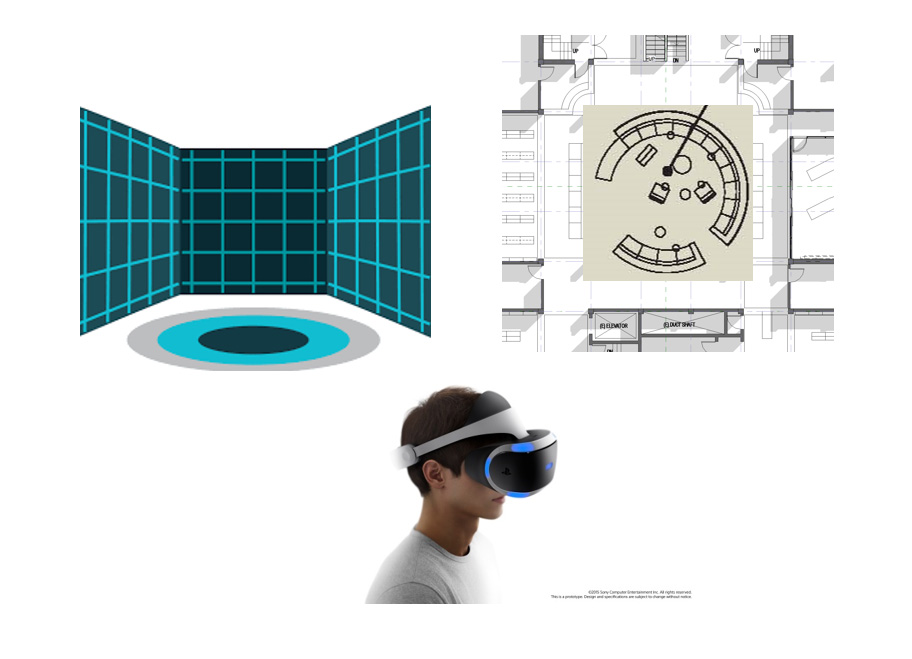
Research consistently shows that hybrid learners drive library demand upward, not downward, by clustering in group spaces for collaborative coursework. Model this independently.

Establish a planning horizon of ten to fifteen years and build a low, base, and high enrollment scenario into every spatial zone so the program can defend any of three capital outcomes.
The written record of assumptions behind each scenario is what gives the space program its authority in front of a capital committee. Any future revision can then be traced to a changed assumption.
Collection Forecasting: Linear Feet, Working Capacity, and the Digital Offset
Where Precision Separates Professional Planning from Guesswork
Collection space is the domain where the precision of an academic library planner most visibly separates from generalist architectural guesswork. The calculation begins with a physical audit of the existing collection measured in linear feet, not volumes, because linear feet translate directly into shelf runs and shelf runs translate directly into gross floor area. The professional planning standard for shelving working capacity is 86 percent of total linear footage; beyond that threshold, reshelving becomes operationally difficult and browsing degrades. A collection at 83 percent working capacity has roughly three to four years of print growth remaining before the shelving system stops functioning efficiently.
The volumetric conversion is straightforward once the data are clean. Research drawn from academic research library audits establishes that the average book in a mixed humanities and social sciences collection measures approximately 0.99 inches in width, yielding roughly 12 volumes per linear foot of shelving. Bound periodicals, averaging 1.77 inches, yield approximately 7 volumes per linear foot. For a mixed print collection of books and bound journals, planning practitioners use a blended rate of 9 volumes per linear foot as a defensible working average. These are not estimates; they are verified measurements from real collections, and they allow a planner to convert a circulation system's volume count into a precise linear footage requirement.
The digital offset complicates — and enriches — this calculation. As a library migrates journal subscriptions from print to licensed electronic access, it recovers linear footage at a predictable rate. Institutions that have tracked this transition carefully have documented meaningful shelf savings as print back files are deduplicated or relocated to high-density storage. The key variable is faculty tolerance for withdrawal and storage decisions, which must be tested through structured focus groups and collection surveys before any space recovery is credited to the program. A planner who credits aggressive digital offsets without faculty validation is building a space program on sand.
High-density automated storage retrieval systems represent the outer boundary of collection-space efficiency. The first academic ASRS installation at California State University, Northridge in 1991 demonstrated that such a system could store approximately 950,000 volumes in 8,000 assignable square feet — roughly one-tenth the floor area required for the same material in open conventional stacks. For institutions with large legacy research collections and limited building footprints, an ASRS component is not an exotic addition; it is a capital-efficient strategy that the space program must evaluate explicitly, with its own retrieval time service-level agreement. Library master planning always treats storage strategy as a first-order space variable, not an afterthought.
Auditing the collection in linear feet by format category — monographs, bound serials, oversized materials, special collections, government documents — before calculating space requirements.
Modeling continued print growth, moderate digital migration, and aggressive digital-plus-storage strategies, each producing a different gross area requirement for the capital program.
Crediting digital offsets only after validating faculty deaccession tolerance through direct consultation. A projected space savings that faculty reject in year two of a building project is a liability, not an asset.
Evaluating ASRS for collections exceeding 500,000 volumes in constrained footprints. The capital cost typically pencils out when compared with the cost per square foot of full open-stack construction.
Seating: Moving Beyond Population Ratios to a Utilization-Driven Model
Why Percentage-Based Thinking Fails at Peak Load
Seating is where most space programs go wrong, and the reason is familiar: planners reach for a percentage. The Association of College and Research Libraries once recommended seating for 25 percent of the student population; that standard has been rescinded. The Association for Learning Environments offered a 2006 benchmark of 12 percent for undergraduates and 30 percent for graduate students; that figure has also been retired as a planning standard. What replaced them is not another percentage, but a methodology grounded in actual utilization data, and it is the approach a serious academic library planner applies.
An informal survey conducted during the ALA Buildings for College and University Libraries Committee in December 2025 reflected a consensus that modern libraries should plan for seating between 25 and 33 percent of FTE — a range significantly higher than historical benchmarks. But the range alone is not actionable. What determines where on that range a specific institution lands is a combination of gate count data, peer benchmarking, and a forecast of how the student population will actually use the building. Research developed from ARL data covering 94 libraries established a replicable methodology: divide the projected future student population by a peer-calibrated figure for annual visits per student, then divide that projected gate count by a peer-calibrated figure for annual visits per seat. Using that dataset, the peer average settled at approximately 72 annual visits per student and 628 annual visits per seat. For a campus projecting 30,000 students, that methodology produces an estimated seat count of roughly 3,250 — approximately 11 percent of population — but the rate shifts materially depending on the institution's residential character, its commuter ratio, and the quality of competing study environments on campus.
Quality of seating matters as much as quantity. Some leading institutions plan library seating at a 25 percent ratio while others operate at ratios as low as 15 percent. The difference is not negligence; it reflects how those institutions define a seat. A standard reading carrel for quiet individual study requires approximately 36 square feet per person. A collaborative worktable seat operates at a different effective density. A multimedia production workstation, which needs roughly 51 inches of horizontal surface compared to a standard carrel's 36 inches, claims meaningfully more area per occupant. The space program must specify not just total seat count but the distribution of seat types — solo carrels, group tables, lounge seating, seminar-style enclosed rooms, and production workstations — because each type generates a different net square footage allocation and a different acoustic zone requirement.
Peak demand is the planning variable that percentage-based thinking systematically ignores. Library occupancy follows a tidal pattern: building pressure during midterms and finals routinely exceeds twice the average daily occupancy. A space program based on average utilization will produce a building that becomes a source of institutional embarrassment — and student frustration — during the weeks when academic pressure is highest. The program must explicitly address peak load through a combination of base seating inventory, flexible zones that can shift from casual to dedicated study use, and reservable space that can be deployed on demand. This is not primarily an architectural problem; it is a programming problem, and it must be resolved before an architect receives the brief.
Seating Program: Five Disciplines
Use population percentages only as a sanity check against a utilization-based seat forecast. The ACRL 25 percent standard and the A4LE 2006 benchmarks have been retired precisely because they cannot account for how a specific institution's population actually uses space.
Assemble comparable institutions including gate count, seat count, and student FTE. Calculate peer-average visits-per-student and visits-per-seat ratios to anchor the forecast in real institutional behavior rather than national averages.
Carrels, group tables, lounge seating, enclosed group study rooms, and production workstations each carry different area requirements and acoustic zone implications. The mix determines infrastructure costs as much as it determines total occupancy.
Establish a specific percentage of seats to be reservable or reconfigurable for peak-period demand. Building pressure during midterms and finals routinely exceeds twice the average daily occupancy; the program must absorb this spike.
Research consistently shows that flipped classroom and hybrid learning models drive group study demand upward rather than reducing physical library use. These pedagogical shifts must be mapped to spatial typology before seat counts are finalized.
Include flexible zones that can shift from casual to dedicated study use on demand. Reservable space that can be deployed during high-use periods is a programming decision, not an architectural one, and must be resolved before the architect receives the brief.
Staff Space, Service Points, and the Program as an Institutional Argument
The Sections Most Likely to Be Sacrificed — and Why They Cannot Be
Staff workspace and service point configuration are the least glamorous sections of a space program and the most likely to be sacrificed when a budget shortfall appears. The Project Information Literacy study of 22 building projects documented that when budget pressures forced trade-offs, improvements to collection spaces and staff work areas were the first to be eliminated in favor of protecting student-facing zones. The consequence is predictable: staff crowded into undersized back-of-house spaces, service counters poorly positioned relative to building entry and high-traffic zones, and a building that cannot staff its own complexity. The program must protect these areas with the same evidentiary rigor it applies to seating.
A service point planner approaches the desk configuration problem through behavioral analysis before assigning square footage. Where do first-time visitors enter and pause? Where do returning users go immediately without looking for signage? Where does the highest density of question-asking behavior concentrate during peak periods? These are ethnographic questions, and answering them through structured observation — not assumption — determines whether the reference desk belongs at the building entry, behind a makerspace, or consolidated with a research consultation suite. The area allocation follows the positioning decision; the positioning decision should never follow the area allocation.
The finished space program is not a list of rooms with square footages. It is an institutional argument presented in spatial terms. Every zone should carry a clear statement of the service it supports, the population it serves, the peak load it must absorb, the adjacency it requires, and the flexibility it must retain across a fifteen-year planning horizon. This is the document that must survive not just the architect's first schematic design, but the value engineering process, the construction document phase, and the first post-occupancy review when someone asks why a particular room works the way it does. An academic library planner who builds that document with clean data and coherent reasoning gives an institution a foundation it can defend at every stage of the capital process.
Allocating staff workspace based on headcount projections for the life of the building, not current staffing levels, with provision for a minimum 20 percent growth in positions.
Determining service point locations through behavioral observation of existing patron flow before drawing any floor plate, then allocating area to support the confirmed configuration.
Including processing, collections management, IT infrastructure, meeting rooms for internal teams, and loading dock access in the program with the same specificity as public zones. These operational requirements, once designed out, cannot be reclaimed without renovation.
Protecting staff and collections program areas against budget-driven elimination by tying each square footage allocation to a named service outcome and a measurable operational requirement — not just a room count.
The Space Program Translation Process: Six Steps from Data to Defensible Numbers

A Structured Sequence That Keeps the Program Grounded in Evidence
An academic library planner follows a structured sequence that converts raw institutional data into a zone-by-zone area allocation. Each step produces a deliverable that feeds the next; none can be skipped without introducing risk that compounds through design and construction. The process is iterative rather than strictly linear — enrollment assumptions will be revised, curriculum priorities will shift — but the sequence establishes a discipline that keeps the program grounded in evidence at every revision.
Six Steps in Detail
Define a planning horizon of ten to fifteen years and develop three enrollment scenarios — conservative, base, and optimistic — for each student cohort type: residential undergraduate, commuter undergraduate, graduate, professional, and distance-local. Obtain the institutional academic plan and admissions forecast from the registrar and the provost's office. Document the assumptions behind each scenario in writing so that any future revision to the program can be traced to a changed assumption rather than to arbitrary recalibration. This written record is what gives the space program its authority in front of a capital committee.
Interview academic deans, department chairs, and the library's subject liaison team to identify program launches, retirements, and pedagogical shifts anticipated within the planning horizon. Translate each shift into a spatial consequence: a new engineering design program implies fabrication and prototyping space; a clinical health sciences expansion implies consultation rooms and specialized database workstations; a shift to team-taught interdisciplinary seminars implies larger enclosed group rooms with presentation infrastructure. Assign each curriculum-driven space type to the program inventory before calculating total area.
Audit the existing collection in linear feet by format category. Apply the 86 percent working capacity standard to establish current utilization and remaining growth capacity. Project annual print growth based on the last five years of acquisition data, adjusted for anticipated electronic migration. Model the digital offset conservatively after conducting faculty focus groups on deaccession tolerance. Evaluate high-density storage options for low-circulation legacy materials. Produce a table that shows required shelving linear footage and corresponding gross area allocation under each of the three collection scenarios, with the digital-migration assumptions explicitly stated for each.
Gather gate count data for the existing library covering a minimum of three years. If gate count data are unavailable or unreliable, conduct a structured space utilization study using systematic observation at timed intervals across a full academic week, including peak and off-peak periods. Assemble a peer dataset of comparable institutions including gate count, seat count, and student FTE. Calculate peer-average visits-per-student and visits-per-seat ratios and apply them to project future seat demand under each enrollment scenario. Distribute the projected seat count across seat type categories and assign net area per seat type based on the dimensional requirements of each. Apply a peak-load analysis to validate that base seat inventory plus flexible reconfigurable capacity can absorb the documented demand spike during high-use periods.
Inventory every staff position, current and projected, and assign individual workspace allocations based on the nature of the work performed — public-facing consultation, back-of-house processing, administrative, technical services, digital services. Position service points on a behavioral flow diagram before assigning area, with explicit adjacency requirements documented for each point. Add processing, collections management, loading and receiving, server and IT infrastructure, internal conference rooms, and staff lounge areas as named line items. Never allow these areas to appear as undifferentiated gross area; each must carry a named function and a justification.
Sum all net assignable areas by zone and apply an institutional gross-to-net conversion factor — typically between 1.55 and 1.70 for a new academic library building, depending on structural bay size, mechanical complexity, and building form — to arrive at gross building area. Cross-reference gross area against the institution's capital campaign target or bond referendum figure using local construction cost benchmarks. If the gross area exceeds the capital envelope, return to the program with specific reduction strategies — reduced collection scenarios, storage alternatives, or phased scope — rather than making arbitrary percentage cuts. Document every trade-off with its service consequence so that the institution understands exactly what it is accepting when it approves a reduced scope.
Putting It Into Practice
What to Do
The following disciplines separate space programs that survive capital review from those that are renegotiated on the construction site. Each reflects a lesson learned across hundreds of academic library planning engagements.
Start the space program at least eighteen months before you intend to hire an architect. The program should inform the architect selection, not follow it. An architect selected before the program is complete will inevitably shape the program to fit a preferred design approach rather than the institution's actual service requirements.
Ground every zone allocation in at least one of three evidence types: utilization observation, enrollment projection, or service-load calculation. Document the evidence source for every line item. A program that cannot answer "why this number?" for any zone is a program that will be renegotiated under budget pressure.
Conduct faculty focus groups on collection deaccession tolerance before crediting any digital migration offset to the program. Unvalidated assumptions in this area have undermined building programs at institutions of every size. A projected space savings that faculty reject in year two of a building project is a liability, not an asset.
Build a phasing strategy into the program so that the institution can open a first phase at a capital figure within reach and expand to full program as enrollment and resources allow. A program with no phasing option forces an all-or-nothing capital decision that frequently results in scope reductions made without service-consequence analysis.
What to Avoid
Do not use a single enrollment percentage as the sole basis for a seating target. Both the ACRL 25 percent standard and the A4LE 2006 benchmarks have been retired precisely because they cannot account for how a specific institution's population actually uses space.
Do not allow an architect to begin schematic design before the space program has been reviewed and accepted by the library director, the provost, and the facilities planning office. Changes made during design cost multiples of what the same change would cost during programming.
Do not build a program that optimizes for average daily occupancy while ignoring peak load. The building that feels comfortable on a Tuesday in October will feel catastrophically undersized on the Monday before finals. Peak load is a programming problem, not an architectural one.
Do not omit loading dock access, server room capacity, and processing workflow paths from the program. These operational requirements, once designed out, cannot be reclaimed without renovation. They must appear as named line items with justified square footages, not as undifferentiated gross area.

Questions to Ask Before the Program Is Complete
Seven Diagnostic Questions That Reveal Program Readiness
A space program that cannot answer each of these questions with documented evidence is not ready for architect selection. These questions are not a checklist; they are a diagnostic that reveals where the program's evidentiary foundation is solid and where it rests on assumption.
1. What is the institution's enrollment projection by cohort type for each of the next five, ten, and fifteen years, and which academic programs are driving that growth?
2. What curriculum changes — new programs, new pedagogies, new academic partnerships — are planned within the building's design life, and what spatial typologies do they require?
3. What is the current collection size in linear feet by format, what is the current working capacity utilization rate, and what is the documented annual growth rate for each format category?
4. What is the library's current gate count, and how does it compare to peer institutions on a visits-per-student and visits-per-seat basis?
5. What is the faculty's documented tolerance for deaccession, remote storage, or format migration, and has that tolerance been tested through structured consultation rather than assumed?
6. What gross-to-net conversion factor is being applied, and has it been validated against comparable academic library construction projects completed in the same region within the last five years?
7. What is the institution's capital envelope for the project, and does the program include a phasing strategy that connects each phase to a specific enrollment or service-load threshold?
Related Reading
How a master plan connects zone-by-zone space allocations to the institution's long-term service commitments and capital sequencing strategy.
Behavioral analysis methods for determining where service desks, consultation suites, and technology stations belong before area allocations are assigned.
How feasibility studies, usage data, and return-on-investment models are assembled into a fundable capital case that survives public scrutiny.
Facility planning and spatial strategy guidance for college, university, and school library environments facing enrollment growth, digital transition, and evolving pedagogy.
A strategic overview of how Aaron Cohen Associates approaches academic library planning engagements, from initial assessment through post-occupancy review.
Core methodologies and decision frameworks for administrators, trustees, and architects who are starting or restarting a library planning process.
How quantitative evidence drawn from circulation patterns, enrollment trends, and collection use data is assembled into a brief that survives administrative scrutiny and bond campaign review.
Begin Your Space Program
Aaron Cohen Associates has guided academic library space programming for more than fifty years, translating institutional enrollment data, curriculum trajectories, and collection forecasts into defensible square footage programs that survive budget review and serve communities for decades. If your institution is preparing for a capital campaign, a bond referendum, or an architect selection, the space program is where the work begins.
We work with library directors, provosts, facilities planning offices, and capital campaign teams at universities, colleges, and specialized academic institutions of every scale. The engagement begins with your data and ends with a document your architect can trust and your board can approve.
Contact Us to Start Your Space ProgramSources

Research Informing This Analysis
Library Design: How Many Seats Do We Need? — Elliot Felix and Martha Kyrillidou, Library Assessment Conference 2019
Planning and Designing Academic Library Learning Spaces: Expert Perspectives — Project Information Literacy, Alison J. Head, 2016
V. Space Planning Options — CLIR Report: Library Buildings and the Building of a Collaborative Research Collection at the Tri-College Library Consortium
Academic Library Building Design: Resources for Planning — Standards and Guidelines, ACRL and Core
Quality Approach to Library Planning — Aaron Cohen Associates Library Planning Blog